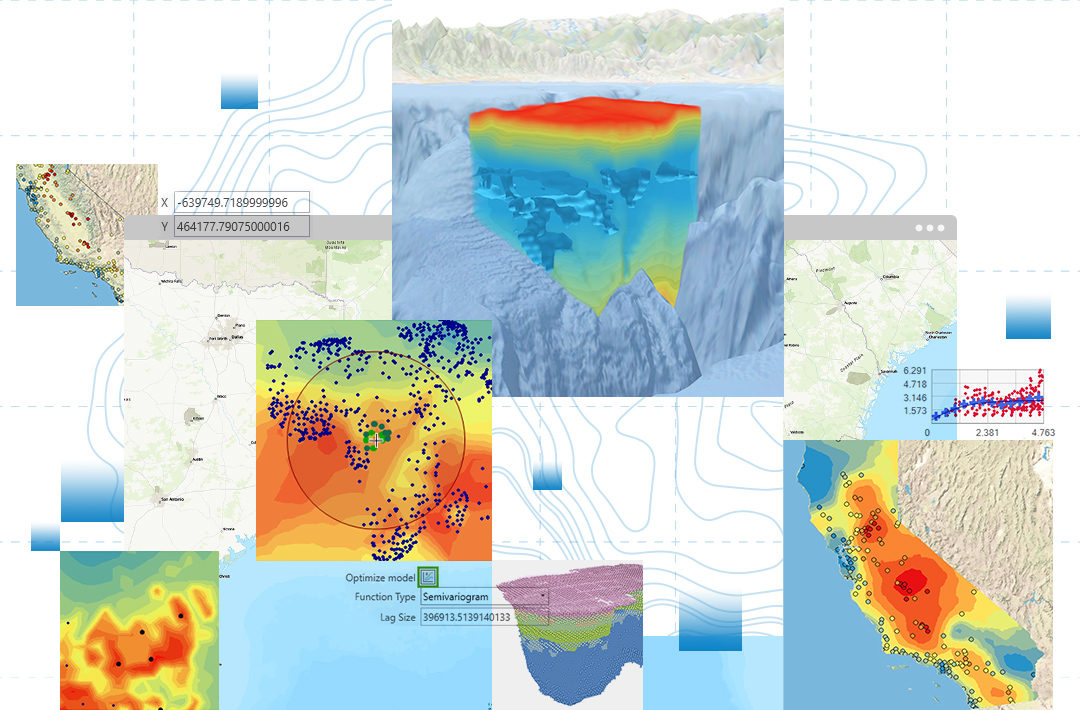
Skip to Content

Common Questions

Any organization or individual who needs to statistically explore data and create surfaces for a number of variables will benefit from this statistical software package. Some of the various fields that use ArcGIS Geostatistical Analyst include agriculture, geology, meteorology, hydrology, archaeology, forestry, oceanography, fishery, health care, and environmental studies.

ArcGIS Geostatistical Analyst complements Spatial Analyst. Most of the interpolation methods available in Spatial Analyst are represented in ArcGIS Geostatistical Analyst as well, but in Geostatistical Analyst, there are many more statistical models and tools, and all their parameters can be manipulated to derive optimum surfaces. Additionally, Geostatistical Analyst provides exploratory spatial data analysis tools not available in Spatial Analyst, such as an interactive wizard that simplifies the interpolation process and provides users with surface previews before applying them. Spatial Analyst has many functions in other areas, such as map algebra, combinational operators, and data conversion.

ArcGIS Geostatistical Analyst expands the number of deterministic and geostatistical interpolation methods and provides many additional options. In particular, Geostatistical Analyst provides a variety of different output surfaces such as prediction, probability, quantile, and error of predictions. Surfaces can be displayed as grids, contours, filled contours, and hillshades or any combination of these renderings. These surfaces can be exported in raster and shapefile formats for working together with other extensions such as ArcGIS Spatial Analyst. ArcGIS Geostatistical Analyst also includes an interactive set of exploratory spatial data analysis tools for exploring the distribution of the data, identifying local and global outliers, looking for global trends, and understanding spatial dependence in the data.

Yes. Esri provides tutorials, training, and other technical support.

Any data that has associated spatial coordinates can be used in ArcGIS Geostatistical Analyst. These data can be arrayed spatially as random points, as a regular grid, or as centroids of polygons. Examples are temperature measured at monitoring stations, digital elevation models (DEMs), and cancer rates per county.

Exploratory spatial data analysis (ESDA) is a set of graphic tools for determining statistical data features and which interpolation method is appropriate for the data. With it, you can explore the distribution of the data, look for global and local outliers, look for global trends, examine spatial autocorrelation, and understand the correlation between multiple datasets. The views in exploratory spatial data analysis are interactive with ArcMap. Data selected with these tools will also be selected in ArcMap and in all the other exploratory tools.

Interpolation methods derive surfaces from measured samples to predict values for each location in a landscape. ArcGIS Geostatistical Analyst provides two groups of interpolation methods: deterministic and geostatistical. All methods rely on the similarity of nearby sample points to create the surface. Deterministic methods use predefined mathematical functions for interpolation. Geostatistical methods rely on statistical features of the data. Geostatistical models also assess the uncertainty of the predictions.

Yes. One of the goals of exploratory spatial data analysis is to find unusually large and small values (outliers), which can be either errors or the most interesting data in the dataset. Semivariogram/Covariance Cloud and Voronoi Map tools are especially useful for finding unusual data.

ArcGIS Geostatistical Analyst will work with as few as 10 data measurements. However, the more data measurements you have, the better your prediction is likely to be. Data with weak spatial correlation usually requires more measurements than data with strong spatial correlation. For kriging, the software requires a minimum of 10 data points to create a surface.

Yes. The Geostatistical wizard will only use the selected subset of input data to create a new surface.

No. ArcGIS Geostatistical Analyst provides the necessary tools for data exploration and variography analysis. Many analytic tools are included to create accurate surfaces such as detrending, declustering, checking for bivariate normality, data transformations, cross validation, validation, and model comparison.

To determine the best interpolation technique, use exploratory spatial data analysis tools. For example, based on the result of trend analysis, you may want to use the local polynomial deterministic interpolation method to remove large-scale variation from the data before using one of the kriging models.

As a rule, deterministic interpolation techniques (inverse distance weighted, radial basis functions, and local polynomial interpolation) should not be used for decision making, because they do not provide information on how good their predictions are. Geostatistical interpolation techniques (e.g., kriging) can be chosen based on the result of exploratory spatial data analysis and diagnostics (cross validation and validation).

Yes. Block interpolation is available for all interpolation methods, and the results of block interpolation can be saved to raster.

Yes. The current version of ArcGIS Geostatistical Analyst does support barriers.

Buy ArcGIS Geostatistical Analysis

Buy now

Have any questions?

Chat now

Begin a conversation online.

Start chat

Send a message

Get an email response.

Start my message

Call us

Speak with a representative.

1-800-447-9778
(United States)
Outside the United States