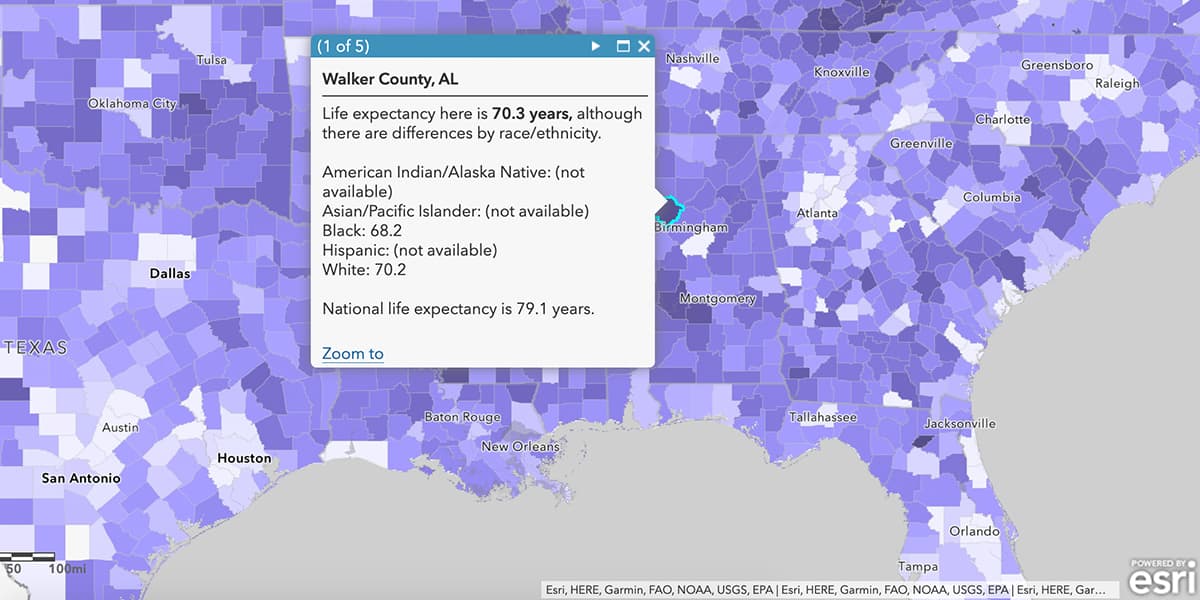
Nonprofits use location information and interactive maps to see, understand, and tell the stories of their communities with simple, visual language. For example, childhood obesity often occurs in communities that are located in food deserts or in areas without adequate public green space. Or, populations suffering disproportionately from COVID-19 may be located in low-income communities far away from adequate health services. Telling these stories through the lens of place helps reveal patterns and relationships, and connects the dots on the many factors that impact people’s lives.
ArcGIS StoryMaps provides a simple, visual language to show the content and context of place and the communities that live there. They bring together social, environmental, and economic data in an immersive, multimedia environment that is easy to use and inspires and engages communities.