Like others in America, we have become very concerned about the growing mental health crisis in this country. It seems to be on everyone’s mind these days. The New York Times is doing a series of essays and op-eds on mental health. Not to be outdone, Los Angeles Times staff writer, Deborah Netburn, recently shared her empathetically-oriented take on the issue, promising diverse perspectives on mental health along with tools and resources for Angelinos in upcoming articles. From coast to coast and everywhere in between, people are recognizing the need to do more, including the White House.
In anticipation of President Biden’s strategy announcement for improving mental health resources in the U.S., the White House put out a fact sheet in March 2022 that provides some pretty grim statistics:
- Two out of five adults report symptoms of anxiety or depression.
- Black and Brown communities are disproportionately undertreated – even as their burden of mental illness has continued to rise.
- Even before the pandemic, rates of depression and anxiety were inching higher..
- The grief, trauma, and physical isolation of the last two years have driven Americans to a breaking point.
The President’s plan to address this growing problem includes:
- Strengthening system capacity – particularly by increasing the number of mental health providers and training front-line providers in mental health care
- Prioritizing vulnerable communities
- Strengthening community-based crisis response, including the launch of the “988” crisis response line
- Improving access to care
- Creating healthy environments
All these inputs and the latest release of data from County Health Rankings inspired us to tell the mental health story with maps. The geographic approach to mental health in America can help unravel the complexity of multiple environmental stressors, identify various populations at increased risk, highlight gaps in access to mental health care, and aid in prioritization decisions for allocating new resources.
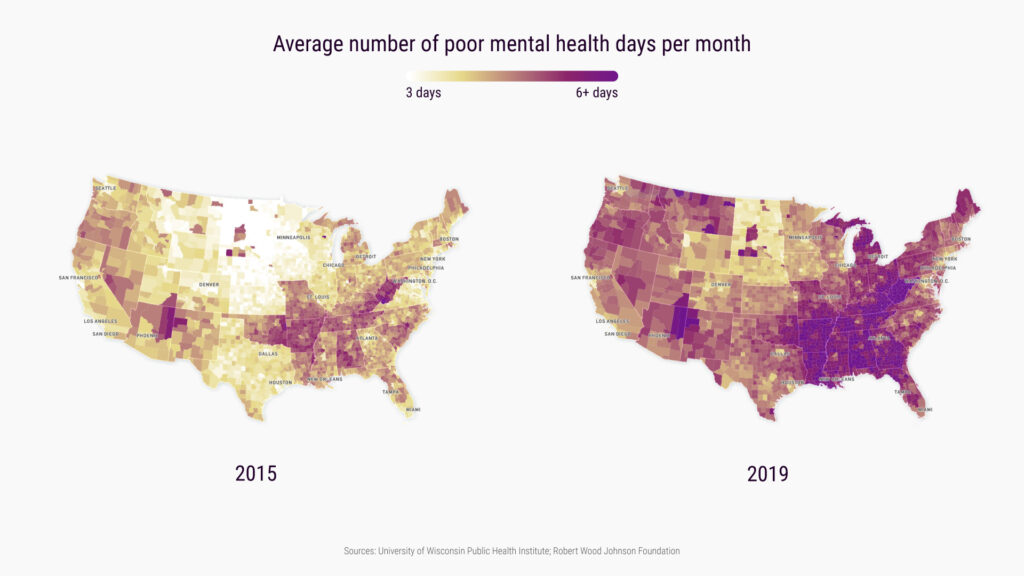
In a new story created with ArcGIS StoryMaps, we show how pervasive poor mental health has become in the United States. Our analysis indicated that there was nearly a 40-fold increase in the number of counties where individuals reported five or more poor mental health days per month on average from 2015 to 2019. It’s clear that a mental health crisis was already affecting wide swaths of the US even before the COVID-19 pandemic, which is widely believed to have worsened mental health for millions of people.

As you read through the story, you’ll gain a greater awareness of the extent of the mental health crisis in the US:
- How mental health outcomes have changed from 2015 to 2019. In 2015, just 33 counties in the US reported five or more poor mental health days per month on average. 1,321 counties in the US reported five or more poor mental health days per month on average in 2019, an increase of nearly 40-fold in five years.
- This dramatic increase of self-reported mental health days in the years 2015 to 2019 shows that the US mental health crisis, which many attribute to the COVID-19 pandemic, was already forming before any case of COVID hit.
- Charts and maps that correlate mental health and several risk factors: physical health risk factors (obesity), economic risk factors (unemployment), contextual risk factors (income inequality), and social risk factors (single-parent households).
- Where communities are doing a solid job of providing primary care and mental health care, as well as areas that may need more resources and experts.
The story is our way of sharing how mapping and spatial analysis can expand local understanding of the key threats to mental health and wellbeing and also serves to provide insights about delivering the right interventions in the right places, getting us on a better path forward.
But we suspect many of you will want to do your own mapping – and you should. The data is already prepared for you. All of the data used in the story came from the County Health Rankings1, a collaboration between the Robert Wood Johnson Foundation and the University of Wisconsin Population Health Institute. Since 2010, this annual population checkup has been conducted to measure the health of nearly all counties in the nation and rank them within states.
Counties are ranked within their state on both health outcomes and health factors. Counties with a lower (better) health outcomes ranking than health factors ranking may see the health of their county decline in the future, as factors today can result in outcomes later. Conversely, counties with a lower (better) factors ranking than outcomes ranking may see the health of their county improve in the future.
Accessing the data from Esri’s Living Atlas of the World, you’ll note that the newly released feature layer contains 2022 County Health Rankings data for nation, state, and county levels. The rankings are compiled using county-level measures from a variety of national and state data sources.
Now we have something to be happy about.
1 It is worth sharing that while the County Health Rankings is providing the data as their 2022 release, the underlying data is based on information collected in previous years. All the data points we used from the 2022 release were collected in 2019 unless otherwise noted. This is the nature of public health data. The most current data available is often a few years old.

