For centuries Santa’s toy manufacturing and distribution centers have been headquartered at the North Pole. This location has played a strategic role in ensuring timely delivery of toys to millions of children across the world in a single night. An impressive achievement that has been repeated annually for well over a millennium and a half. However, population growth, an international presence, and a resource-intensive supply chain has created challenges for the organization. Santa Claus, owner and founder of Santa’s Workshop, had been using the same manual data collection methods to build his naughty and nice list since the early days. “Making a list and checking it twice is the way we’ve always done it”, said Santa. “We did the best we could with the resources we had, but data quality has always been a challenge”.
More than this, Santa’s behavioral monitoring programs were falling short of expectations. With more children celebrating Christmas than ever before, he didn’t always know who’s naughty or nice. He needed a new approach and decided to open regional offices in malls and neighborhood events to collect toy requests and capture observational data. While this proved very successful at first, soon long lines and extended wait times were putting downward pressure on Santa’s NPS score. Perhaps the most important metric monitored by the North Pole.
To meet the growing demands of a modern world, he solicited help from his elves…
The mission was simple: sit on the shelf and provide real-time data collection back to headquarters. This was a major upgrade and significantly improved the reach of the Santa’s field operations. However, he found that at times elves were not complying with data collection integrity standards. Furthermore, many elves were often finding themselves in the most precarious of situations, which we cannot disclose the details of due to the North Pole’s HR policies and ongoing OSHA investigations. Needless to say, Santa had to find a better way to streamline communication between the North Pole and the field to ensure accurate and timely data.
Santa realized that modern problems required modern solutions, so he enlisted help from Esri. He met with Patrick Demer, Solution Engineer, to build some intuitive and interactive web applications that would allow parents and children to self-report toy requests and behavioral conduct to enhance data collection efforts and improve naughty-or-nice decision making.
Parent and Kid Engagement for Improved Situational Awareness
The first step was to understand what information Santa found important. Working together, Patrick and an elite team of elves quickly developed a list of questions for Santa to review. Once they confirmed which questions were important and how to ask them, they got to work. Using the Survey123 web app, they simply dragged and dropped the approved question list onto the survey form, added some configuration and styling (to align with Santa’s branding), followed by a quick test, and off to Santa’s team for final review – easy!
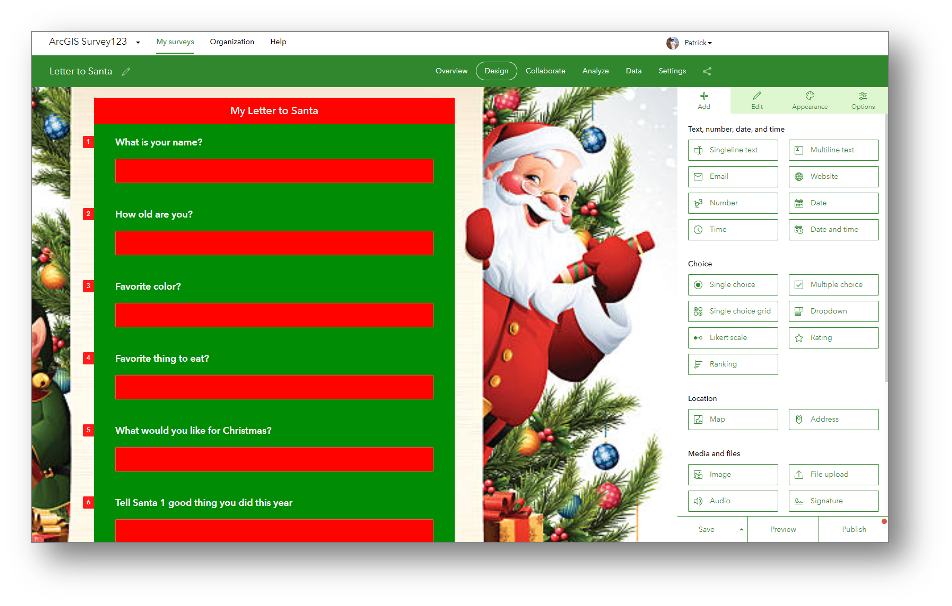
A few small tweaks required by the head elf, and Santa had a final survey that was ready to be shared across social channels and international media outlets with a simple QR code:

Dashboards for Data Visualization and Decision Support
Implementing ArcGIS’s Dashboard was a game-changer for the North Pole. It not only provided a comprehensive view of all incoming letter submissions from across the world in real-time, but it also provided Santa with key insights for at-a-glance decision making.
Once the Survey123 form was shared with kids and parents, data started streaming into the North Pole – and fast! It was time to get to work on the ArcGIS Dashboard so Santa could visually investigate the data. First, the basemap! With a bit of styling and help from Esri’s Living Atlas team, who got into the holiday spirit and created a Christmas themed basemap using the Vector Tile editor app, they were well on their way to bringing Santa’s letter to life, geospatially.
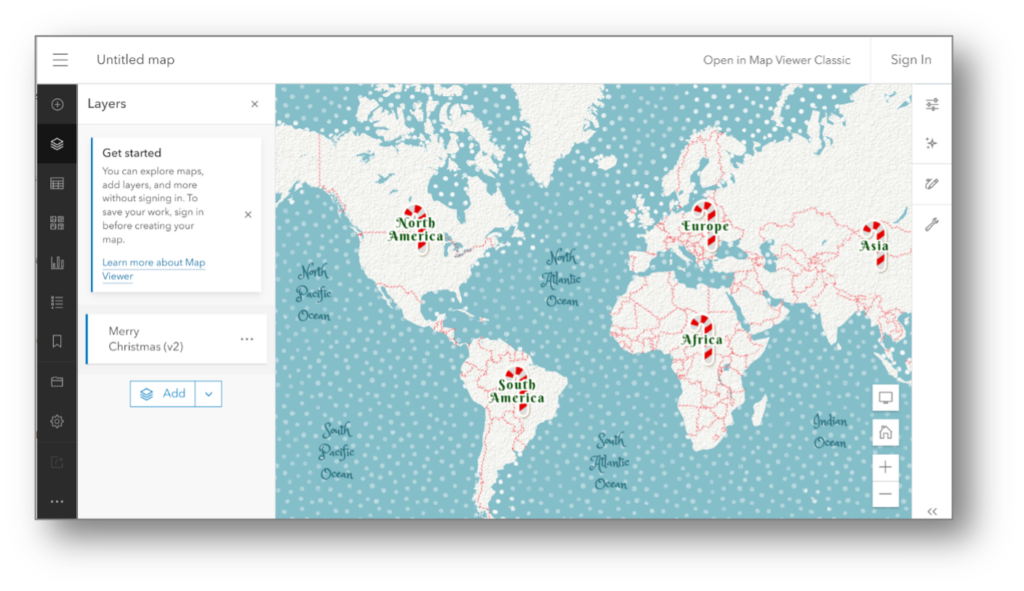
Once the basemap was selected, it was time to build Santa’s Dashboard. Behind the Survey form was a feature layer containing different types of information collected about the children: Harper’s barbie doll request, Emmett’s favorite color yellow, and even Nora’s good deed of the year, snuggling with her family. And most importantly, how good they were all year!
Patrick and team added the feature layer to a webmap so they could display this data as geographic information. With every child’s location now represented as white Christmas tree on the map, Santa would be able to interact with every child’s letter and profile within a single view. Next, the team added some widgets to the dashboard to create unique views of the same dataset.
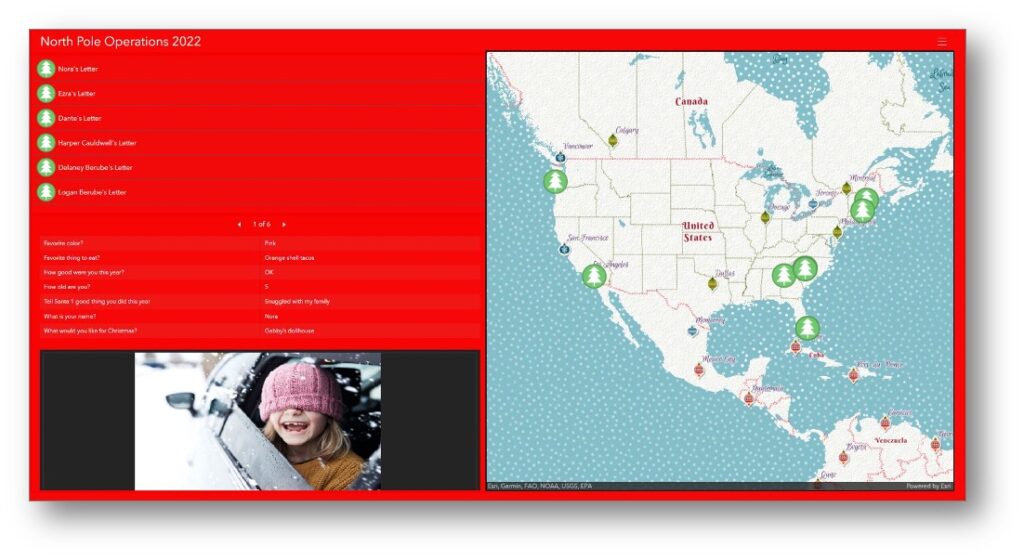
Santa wanted to see the incoming letters in real time in the upper left corner, and then explore the contents of those letters with a picture of the child for proper identification in the lower left. The team spoke not a word but went straight to work. Filled up all the widgets and turned with a jerk; and with a wink of his eye and a twist of his head soon gave the team to know they had nothing to dread. And they heard him exclaim, ere he drove out of sight – Happy Christmas to all, and to all a good night!
Santa’s Geographic Approach Saved the Future of Christmas
When Santa first launched his TTTH, or Toy-To-The-Home, campaign all those years ago, he never thought the simple idea to bring joy and happiness to local children would become an international phenomenon. Santa tried to keep pace with this rapid growth by implementing different strategies over the centuries, but none of them could provide the business agility he was looking for. Santa needed help. He needed a new way of thinking about his operations. He realized that he needed a way to connect maps, technology, data, and people in a way that helped the North Pole make more informed and faster decisions.
With the investments he made in ArcGIS, Santa was able to streamline communications, improve data quality, and increase kid satisfaction across all key geographies. When we asked Santa what’s next in his digital transformation journey, he responded saying, “the investments made in ArcGIS have fundamentally changed the way we work in the North Pole. I look forward to developing new tools and scaling these capabilities to support other needs at the North Pole, such as improving elf engagement, optimizing sleigh routes, or developing a big data strategy to help with naughty and nice list errors. We’ve been considering running a rooftop analysis to understand old roofs versus new roofs, so I know if I can safely land my sleigh. That’s a big one! Improving safety is at the top of our business objectives in 2023.” With the help of Esri and some really smart elves, Santa’s Christmas magic will now continue well into the future.
From all of us on the Infrastructure Team to all of you, “Merry Christmas and happy holidays to you and your families!”