user story
The City of Cibolo Uses Esri Technology to Increase Transparency
By Alyssia Church, GIS/Addressing Coordinator - City of Cibolo, TX
The city of Cibolo is located just outside the northeast corner of San Antonio, Texas. It is a small city with about 30,000 residents, sandwiched between the major routes of I-35 and I-10. Due to Cibolo's desirable geographic location and large swaths of undeveloped land, the last 10–15 years have seen explosive growth in this once-rural Texas town. Expansion continues to march along rapidly, with multiple subdivisions being built each year and businesses quickly filling in the gaps along major thoroughfares. Along with this growth comes an increase in questions and concerns, which are brought to the attention of the city's staff through phone calls, emails, or residents' presentations at city council meetings. Residents may express curiosity about new businesses, concern about road construction projects or stormwater drainage, or just a desire to view site plans or structure renderings.
With so many construction projects going on at once, the city's staff was often overwhelmed by these questions and concerns. It also wasn't easy for the city council and staff to keep track of what was going on and where the projects were located. To mitigate this issue, the city's assistant director of planning and engineering called in her department's geographic information system (GIS) coordinator and requested that a web app be created to keep everyone more informed. Employees from the public works, planning and engineering, and public relations departments as well as the Economic Development Corporation (EDC) were quickly mobilized to assist in gathering information on all the current development projects. In March 2019, the city launched its Current Development Projects web app, using the classic Esri Story Maps Tour template.
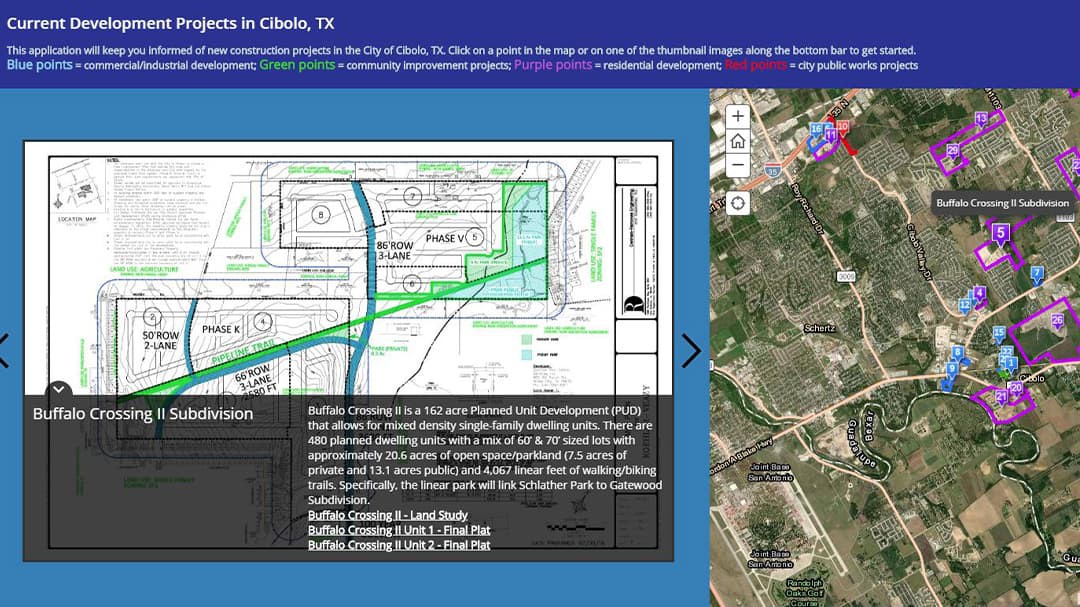
 Cibolo’s initial Current Development Projects web app created with the classic Esri Story Maps Map Tour template.
To make it easier for users to get an overview of the types of projects in their community, each project was assigned to one of four categories, which were color-coded on the map as follows:
- Blue—commercial/industrial development
- Green—community improvement projects
- Purple—residential development
- Red—city public works projects
A polygon layer was added to the Map Tour template's associated web map so that boundaries of larger, or more complicated projects could be shown around numbered project points. Users could either search for a specific address to see what projects were nearby, or click on the numbered points on the map to access an informational side panel and learn more about those projects. For each numbered point shown on the map, there was a short description of the associated project, followed by hyperlinks to PDF documents—hosted on the city's website—of site plans, final plats, or renderings. These were inserted into the Storymap using simple HTML code.
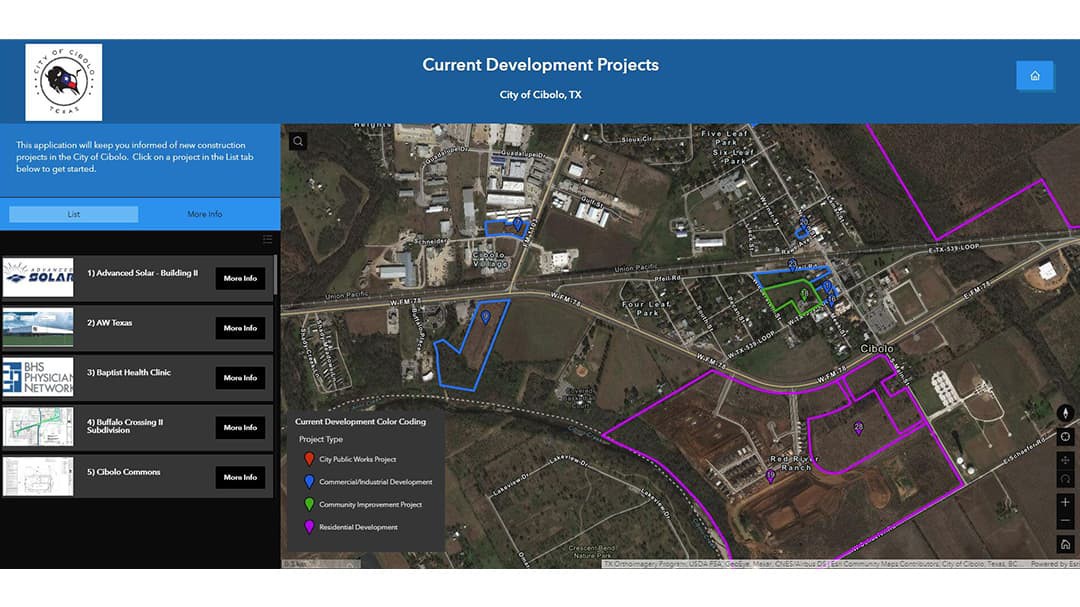
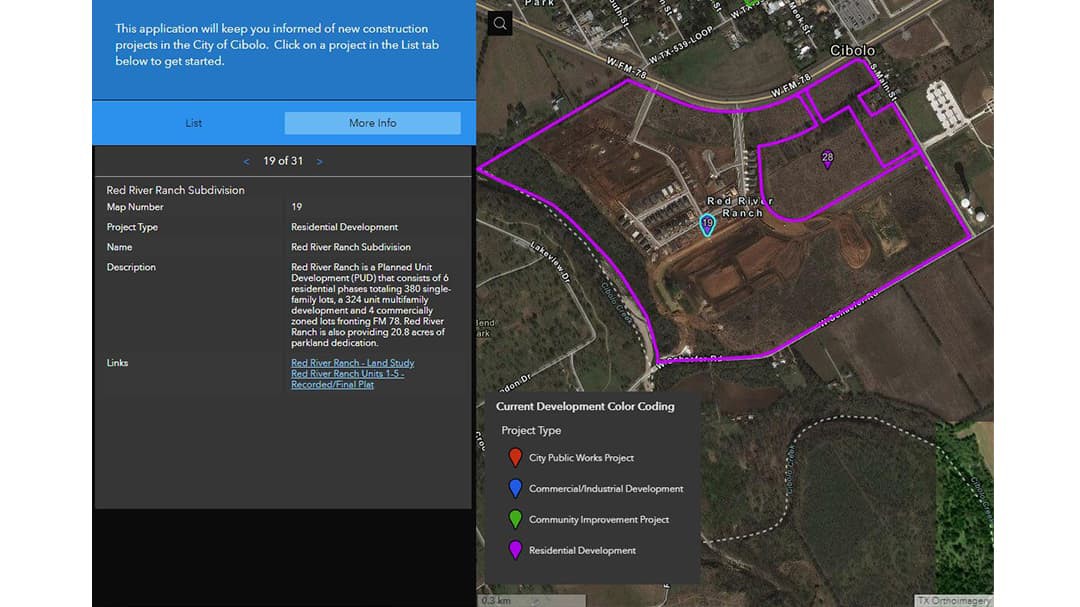
 Cibolo's Current Development Projects web app was redesigned with Esri's ArcGIS Experience Builder. Users can click on points on the map and get additional information on a side panel, including links to development documents.
The Current Development Projects application was a hit with residents, businesses, the city council, and staff. Christine Pollok, the city's public relations manager, states that the web app "allows residents to view what construction projects are happening around our city and increases our ability to visually communicate with our residents. [It] has answered many questions from our residents, and the amount of information that is linked within the application is a one-stop shop for those interested in the project and our community."
Pollok publicized the web app on the city's home page and Facebook page, which instantly drew in the active members of the community. The app later included links to businesses that wanted to show off their new building or location before their doors even opened. The application has resulted in fewer phone calls and emails about development projects, and it has made it much easier for the city council and staff to access information about current projects and answer residents' questions in a timely manner.
The data in the application is updated on a continual basis by the GIS coordinator, who gets automated alerts from the permits office about new commercial and residential projects and is contacted by parks and public works departments whenever they have a new project starting. Due to the sometimes lengthy process of plan reviews and revisions, construction projects are not posted until the developer or contractor is about to break ground, and new businesses are only posted after they obtain their first permit. Public works projects are posted after a preconstruction meeting is held and work is about to begin.
After the Current Development Projects app had been live for a little over a year, the GIS coordinator saw the need for a customizable app that would not require complex coding but would allow for longer descriptions and have a cleaner appearance and a more streamlined, flexible updating workflow. This is when she discovered Esri's brand-new ArcGIS Experience Builder—which turns data and content into mobile-adaptive applications—and redesigned the Current Development Projects app.
