The City of Tucson was able to utilize GIS to make goals and achievements possible through data and data capture. By providing fast and accessible data, Tucson was able to have the most up-to-date understanding of where [key] resources are needed.
case study
Strategic Planning with an Equity Lens—Tucson, Arizona, Addresses the Affordable Housing Crisis
Tucson, Arizona's Housing and Community Development Department created a framework to invest in the city's most vulnerable populations. Tucson adopted the People, Communities, and Homes Investment Plan (P-CHIP) in early 2021 to prioritize and identify the most current data and public outreach efforts to create affordable housing for all residents of the city. P-CHIP's focus areas included equitable access to employment, health, supportive services, and education for all Tucsonans. The plan also focused on building a safer community with inclusive neighborhoods and other infrastructure to provide resources to each person. Lastly, the plan focused on ensuring that every person in the city has access to safe and affordable housing.
P-CHIP provided the framework used to allocate funding to programs and projects that help address the challenge areas identified in the City of Tucson Poverty and Urban Stress 2020 report [per link]. The City of Tucson was able to utilize geographic information system (GIS) tools to collect the data and create a new digital, interactive version of the report.
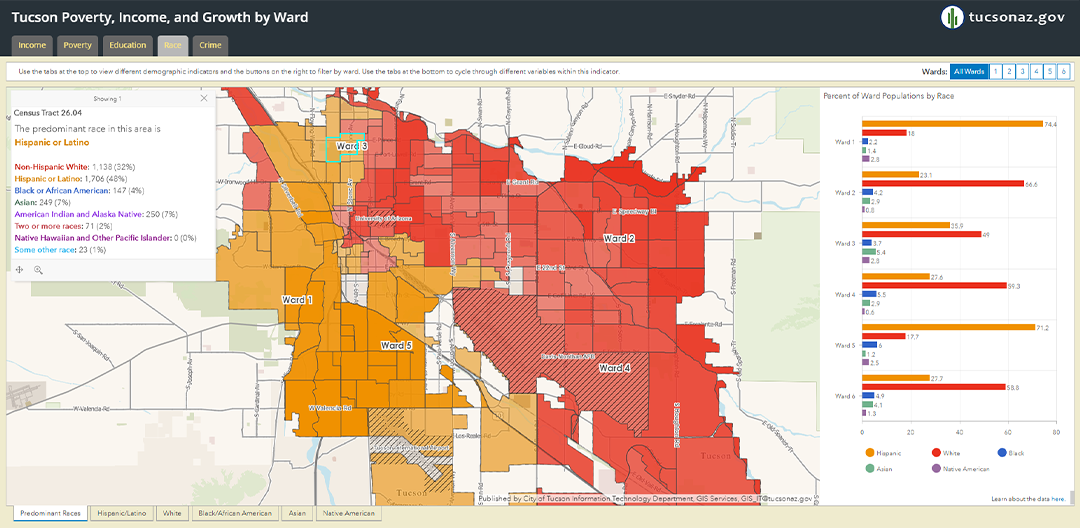
The report included an online survey for community members to view the city's data and submit their thoughts. The survey was online for several months and was shared with the stakeholders who were most likely to use the poverty report, including ward offices, nonprofits, researchers, and community members. In addition, the city used ArcGIS Hub—a community engagement software as a service (SaaS) offering that organizes data and tools—to create an interactive platform to help visualize Tucson's data. The report results were integrated with online mapping tools to create an interactive analysis of different wards or neighborhoods throughout Tucson, based on various types of demographic data such as income, poverty, education, race, and crime.
The public-facing maps can be seen by any individual on the Poverty and Urban Stress website. The Tucson Housing and Community Development Department and community stakeholders can look at specific census tracts to see how the neighborhoods compare to the poverty and stress indicator data in each city, county, and ward. Through maps and census data, the city can classify each area of Tucson by its vulnerability level or its ability to withstand threats such as economic downturns. Individuals are able to see which wards experienced the most poverty while considering the city's low median income. Through the data on the map, it is clear that the city of Tucson has a racially diverse population, with 54.4 percent of the population being non-white groups. The interactive maps show which wards have the largest population of Black, Hispanic, and Native Americans. The maps also show which areas of Tucson have the highest percentage of adults without a high school diploma, and different levels of crime are reported in the many neighborhoods of Tucson. Each of these maps has comparative statistics that can be used by city officials and urban planners to make new jurisdictions to help the underrepresented populations in Tucson.
 Interactive Demographic Data Map and Comparative Statistics from the Poverty and Urban Stress Report
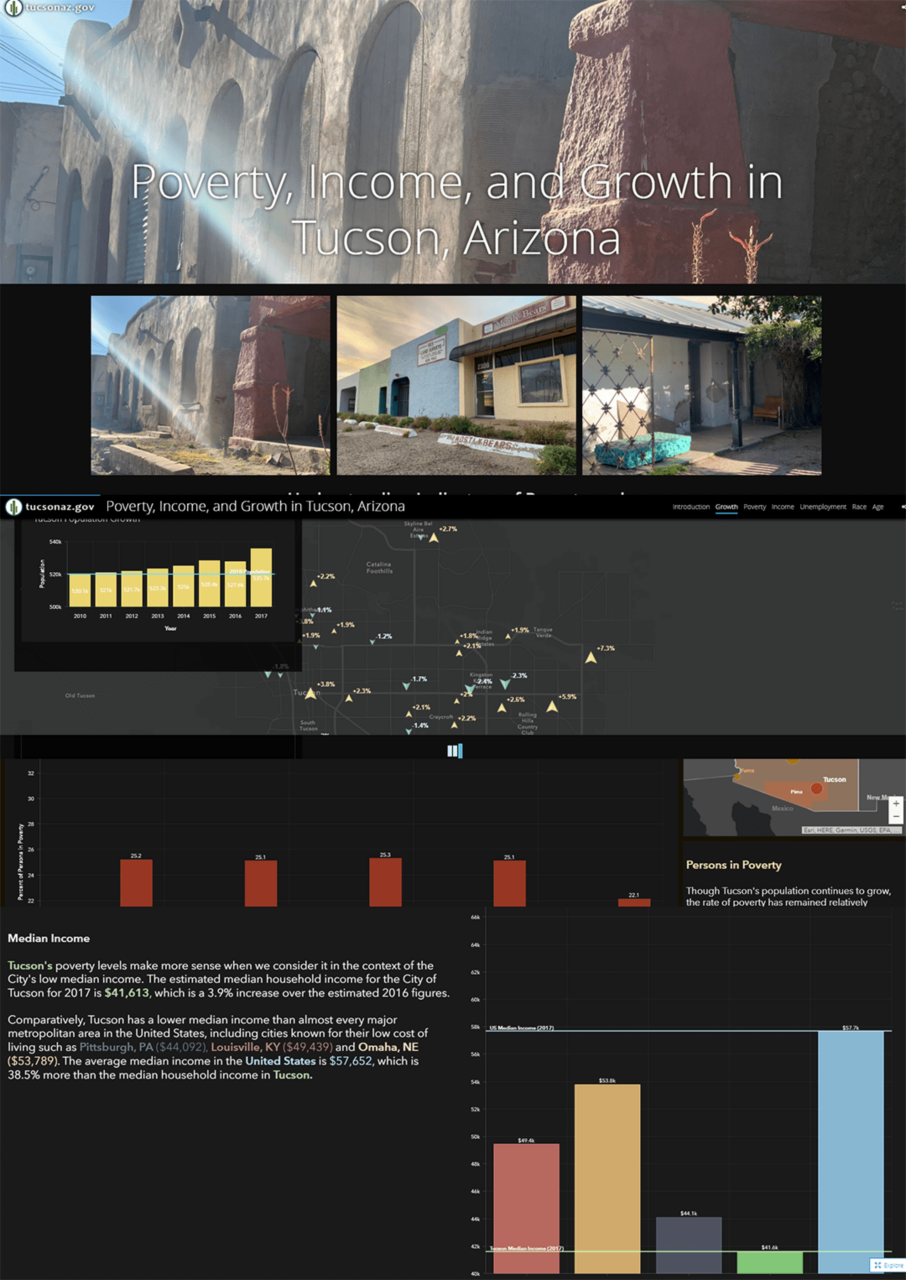
The City of Tucson utilized ArcGIS StoryMaps to show the context of poverty, race, age, and population growth throughout the city by using maps and illustrative graphics. ArcGIS StoryMaps is a digital storytelling app that displays interactive maps and images to inform people viewing the content. The Poverty Income, and Growth in Tucson, Arizona interactive map generates a guided trip through the data to track the community's progress and compare the areas of the city. The interactive StoryMaps story shows how race, age, and unemployment relate to poverty in Tucson and displays the regions experiencing the most economic stress. This tool allows community leaders to identify and share geographic areas of interest that still need the investment of resources . StoryMaps utilizes the Poverty and Urban Stress report to create the narrative and map to show the equity disparities in Tucson.
 This StoryMaps story features an updated geographic view of many of the American Community Survey indicators identified in the 2007 and 2012 poverty and urban stress reports.
By using GIS, the City of Tucson was able to identify priorities in the communities that are eligible for federal and local funding resources. P-CHIP laid out the vision that "every Tucsonan has access to a safe, decent, and affordable home." This plan addresses the city's housing policies and provides guidance to implement affordable housing policies for vulnerable communities. The plan also can summarize education and economic mobility disparities in Tucson. For instance, Poverty Level by Race and Ethnicity data shows that Native American and Black Tucsonans experience poverty at rates nearly twice as high as white residents. A priority area of the plan is to reduce poverty and its effects on people. The City of Tucson intends to track progress toward reaching its stated goals on both an individual project level and a community level. The P-CHIP website, created using ArcGIS Hub, will continue to host data that shows the improvement of the city.
"The City of Tucson was able to utilize GIS to make goals and achievements possible through data and data capture. By providing fast and accessible data, Tucson was able to have the most up-to-date understanding of where [key] resources are needed," said Laura Sharp, lead planner, Housing and Community Development, Tucson.
As P-CHIP continues to develop, ArcGIS Survey123, an online data collection app, will collect key progress metrics quarterly from partner organizations administering human services. The results of this survey will be delivered via two dashboards—one public and one internal—that will be made available on the P-CHIP site. As part of this survey, organizations will be asked to submit stories and photos of meaningful public engagement. These photos and stories will be part of a StoryMaps story that communicates Tucson's impact on the lives of individuals, in a way that numbers alone cannot show. Tucson's ability to showcase the importance of spatial data allows for effective community planning that prioritizes social and economic equity. Planners and administrators can integrate GIS technologies while analyzing and evaluating the data to determine the needs of the Tucson community and justify policy decisions through location. To learn more about community planning, visit esri.com/planning.