New Zealand’s Wellington City Council Relied on the ArcGIS Platform to Quickly Collect Data, Make Decisions.

Just after midnight on November 14, 2016, residents on both the south and north islands of New Zealand were awakened by a 7.8 magnitude earthquake. The Kaikoura earthquake was one of the most complex earthquakes ever recorded, with 21 fault lines rupturing over about 110 miles (180 kilometers).
New Zealand’s capital of Wellington experienced considerable damage. Windows shattered in high-rise buildings, and plaster and masonry fell onto the streets. In the immediate aftermath of the earthquake, the Wellington City Council was under pressure to cordon off the city.
To evaluate the damage and react to a rapidly changing environment, the council had to mobilize fast. Building assessments had to be done under extreme conditions—in high winds and torrential rains—and quick decisions had to be made to get transportation, infrastructure, and the city’s port operating normally again. The mayor, councillors, and senior government officials needed to be briefed with comprehensive, real-time information so they could make sound decisions and communicate effectively with the public to avoid loss of lives.
Geospatial data became an important unifier, and the ArcGIS platform allowed emergency crews on the ground to swiftly gather information and easily share it with officials who were briefing city leaders and the media. This helped the Wellington City Council figure out what was happening throughout the city and make key decisions on whether or not to evacuate citizens, close streets, and demolish buildings.
Understanding the Earthquake’s Effects
Following the earthquake, the Wellington City Council’s Emergency Operations Centre (EOC) was responsible for sharing current information with special council teams, government agencies, and other organizations. To evaluate what was happening around the city and analyze, communicate, and act on these updates, the EOC used 3D building and terrain data in conjunction with geospatial tools supplied by Eagle Technology, Esri’s official distributor in New Zealand.

“Geospatial [technology] was our means of understanding our city, what was happening to it, and the effects that the earthquake and our responses were having,” said Sean Audain, the innovation officer for Wellington City Council.
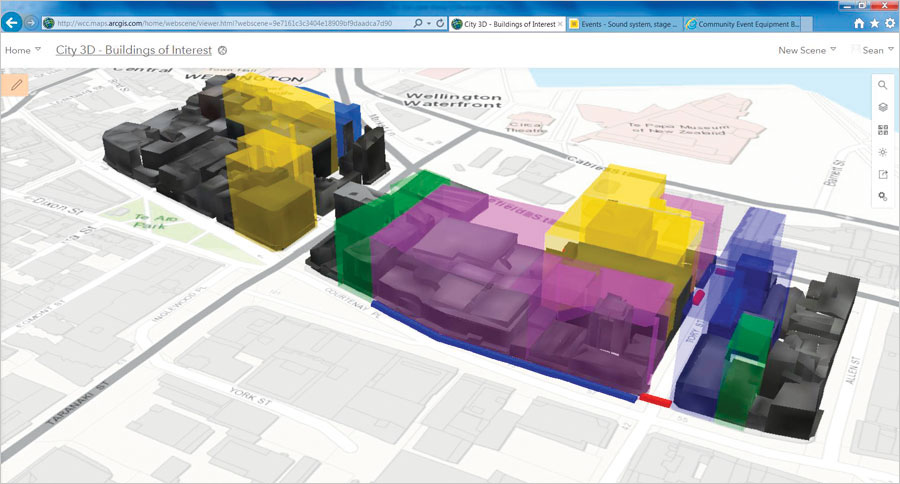
To rapidly collect the first wave of information from the field, the Wellington City Council’s local hosts (city workers who help tourists and homeless people and assist with events) used Survey123 for ArcGIS to record damage throughout the city and requests for assistance from citizens. Additionally, building inspectors used Collector for ArcGIS to record their building assessments, documenting the damage and indicating whether buildings had internal and/or external safety concerns. Working with the people collecting this field data, as well as local utilities and other asset owners, the council’s GIS analysts produced 3D visualizations of the data to showcase a realistic view of the destruction’s extent throughout Wellington and the potential problems that lay ahead for residents, infrastructure, and the economy.
At the EOC’s headquarters, GIS analysts used web maps and web scenes in ArcGIS Online to create a common operating picture that could both be tailored to individual teams and feed into the entire emergency operation. They also created Esri Story Maps apps to communicate with a range of agencies—including New Zealand’s central government, the regional emergency management office, the fire department, and urban search and rescue—that were also working to mitigate the earthquake’s damage.
With all this data displayed in real time, 3D scenes became vital for calculating safety zones—cordoned-off areas around unstable and collapsing buildings. It also allowed the EOC to put these zones into context so decision-makers could view the surrounding streets to see what else needed to be blocked off and which areas could remain open for public use. When possible, the EOC used configurable story maps to share its information with the public to keep everyone abreast of tsunami evacuation zones, road closures, affected transportation services, the locations of emergency water supplies, and more.
Progressing from Response to Recovery
With real-time access to more accurate information, the Wellington City Council could be proactive rather than responsive in managing the aftermath of the Kaikoura earthquake.
“By having a stable, durable way of storing, analyzing, and communicating data, we…managed to transition smoothly from response to recovery,” said Audain.

As aftershocks rolled through, Audain and his team overlayed the incoming earthquake damage data onto bedrock and soils maps to visualize how vulnerable certain areas and populations were to additional destruction, since soft soils shake more than hard rock. With that information, they and the city’s emergency controllers were able to brief government ministers, the mayor, and councillors on how to deal with the earthquake’s immediate aftermath, as well as make well-informed plans for recovery. Thus, even though the environment in Wellington was changing rapidly, senior city council officials had the confidence to make tough decisions quickly.
Ultimately, the Wellington City Council decided that cordoning off and closing the city’s entire central business district was not necessary. This prevented a potentially enormous disruption to daily life in Wellington. Had such a critical part of the city been cordoned off, Wellington would have suffered overwhelming logistical issues and damaging economic deficits, and the community likely would have lost an important feeling of ownership in dealing with the aftermath of the earthquake. Instead, thanks to geospatial information and the ArcGIS platform, the city took a more focused approach to managing this emergency: city building inspectors evaluated over 1,600 multi-level commercial and residential structures, infrastructure teams cordoned off individual streets, welfare teams only evacuated residents in affected areas, and contractors swiftly demolished severely damaged buildings.
“When bad things happen to good people, quick and accurate information is gold for those people, for decision-makers, and for the media,” said Mike Mendonca, chief resilience officer for the Wellington City Council. “In the longer term, geospatial [data] can also help tell the story that supports determining the future of our city.”
For more information on the Wellington City Council’s immediate and extended response to the Kaikoura earthquake, contact Audain.
