
")
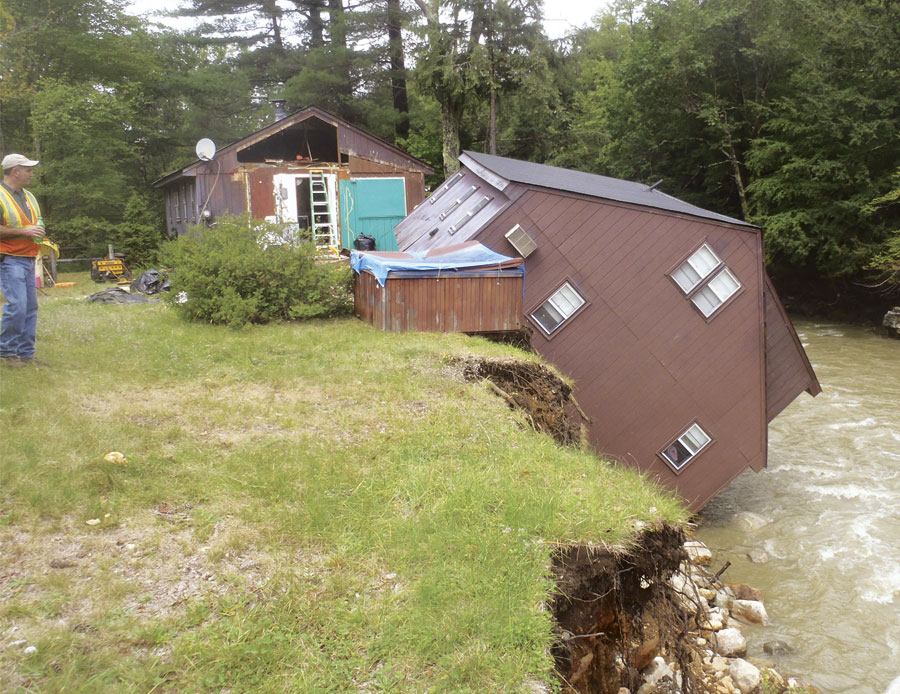
On August 28, 2011, Tropical Storm Irene lashed the Vermont landscape, dumping more than eight inches of rain in 24 hours in some communities. Spring flooding at Lake Champlain had already broken lake level records that year, and Irene’s devastation rivaled that of Vermont’s historic 1927 flood, which took out miles of roads and railroad tracks, more than 1,200 bridges, and numerous homes and buildings.
Irene caused an estimated $800 million in damages. While the wreckage of homes, farms, businesses, roads, bridges, and the natural environment was enormous, it was nothing new. Catastrophic floods have occurred many times in Vermont in the last 100 years, requiring repeated flood recovery efforts throughout the state. And the surprising finding from postflood damage surveys is that most of the destruction comes from fluvial erosion, not floodwater inundation.
Since 2004, the Vermont Rivers Program, housed within the state’s Agency of Natural Resources’ Department of Environmental Conservation, has assessed the geomorphology (the evolution of the physical condition) of more than 8,000 stream miles in the state. The assessments show that Vermont’s streams have been greatly altered since the 1800s. People have straightened rivers to protect roads, used dams to divert river water, and armored stream beds with rock and concrete—all of which change a stream’s width, depth, slope, and sinuosity.
The data indicates that almost 75 percent of the rivers assessed are unstable. After three major floods in 2011, the State of Vermont passed legislation mandating that the Agency of Natural Resources conduct sensitivity analyses of vulnerable infrastructure in river corridors, develop new state flood hazard area rules, and implement a flood-resilient communities program.
")
To this end, the Rivers Program undertook the task of augmenting existing field maps with a uniform, statewide GIS model of Vermont’s river corridors. The department used several Esri software products and extensions to do this, including ArcGIS for Desktop (Basic and Advanced), the ArcGIS Spatial Analyst and ArcGIS 3D Analyst extensions, and Arc Hydro tools.
A River Corridor: More than Water
No river is static. Rivers migrate across valleys over decades and centuries, changing the land as they meander. A stable river, however, is one in a state of dynamic equilibrium—that is, it is able to adjust its width, depth, and slope to efficiently store, transport, and discharge water, sediment, and debris without raising or decreasing the height of its riverbed.
Because of this natural movement, the State of Vermont specifies that a river corridor include not only the channel through which the river travels but also the adjacent land required to restore or maintain the river’s dynamic equilibrium. Interpreting river corridors this way takes into account the meandering of a river in its least erosive form. River corridors that include intact floodplains and wetlands give rivers room to meander and release energy from a flood flow.
The Vermont Rivers Program delineates river corridors based on both existing and estimated meander belt width. River scientists use a custom ArcGIS extension, called the Stream Geomorphic Assessment tool, to evaluate river geomorphology within a specific project area. The tool partially automates the creation of river corridors in ArcGIS, though scientists still have to manually digitize features such as tributary entry points, breaks in relatively consistent stretches of a stream, and valley walls.
Communities where the Rivers Program had done river corridor delineation studies had access to relevant maps of that area, but often they only showed a small area of interest—where, for example, the town might be trying to get a development permit.
“We had river corridor maps, but they were spotty,” said Mike Kline, program manager for the Rivers Program. “Having only ad hoc maps created uncertainty when it came to policy making and development planning.”
As of 2011, most communities still did not have access to river corridor maps—hence the River Program’s mapping project.
Developing the Vermont River Corridor
The Rivers Program limited river corridor development to streams that drain water from more than two square miles of land—or about 5,500 of Vermont’s 23,000 stream miles. Smaller streams were simply assigned a conventional 50-foot riparian buffer starting at the top of the stream bank.
For geoprocessing, the Rivers Program used several statewide datasets, including a stream centerline shapefile; a 10-meter digital elevation model; a 10-meter hydro-enforced digital elevation model (which allowed the team to simulate river flow under bridges and through culverts); road and railroad centerlines; and a shapefile of Hydrologic Unit Codes for subbasins (HUC-8) from the US Geological Survey, which identified the drainage basins in the area.
First, members of the team created valley walls. They followed The Nature Conservancy’s method for developing an active river area, which includes not only the channels that a river travels through but also the surrounding lands that aid the ecological processes of a river system. Using the Path Distance function on stream centerlines and the Vermont digital elevation model, the team members created a raster of the relative cost to travel on a surface upslope from the stream bed. They used an arbitrary cost limit of 1,000 first, as a test; but after the river scientists evaluated the layer against aerial photos and contour lines of the area, plus evaluations from field sites, the team found that a cost value of 550 worked to delineate valley walls along rivers throughout the state. The team then converted the raster to vector format to create polygons of the valley walls.
")
Next, the team defined catchment areas (where water collects and then flows into a waterway) for the length of each stream. The researchers used Arc Hydro tools on stream centerlines and the hydro-enforced digital elevation model to create accumulation rasters for the streams’ basins and catchment areas, as well as to assign the correct drainage area to every segment of each stream.
Although river scientists had already digitized most of the basins’ meander centerlines (approximations of the meander patterns of each river), some still needed to be done. To expedite the process, the team took the stream centerlines in ArcGIS for Desktop and used the Simplify Line command to remove extraneous curves from the rivers’ shapes.
The meander centerlines serve as the basis for the initial river corridor polygon layer, but they have to be buffered by values calculated from fields in the stream centerline shapefile. To do this, the team needed to assign each meander centerline the attributes—such as slope and drainage area values—of the stream segment it represents. But while the meander centerline polylines run near the stream centerlines, they only intersect occasionally. So the group used the Functional Surface toolset in 3D Analyst with the hydro-enforced digital elevation model to assign slope values to the streams. They then assigned slope and drainage area attributes to the stream segments’ corresponding catchment polygons. From there, they intersected the catchment areas with the meander centerlines, which divided the meander centerlines into sections that are geomorphically similar (called reach-break lengths) and gave them the slope and drainage area attributes of the stream centerlines.
Finally, team members calculated the bankfull width—the width of a stream at the point where it spills out of the channel and into the floodplain. They did these calculations for each river segment using Vermont’s hydraulic geometry curve formula, which relates a stream’s channel dimensions to its average annual discharge, and a slope-based channel multiplier, which indicates how many channels wide the full meander belt needs to be for the stream to attain dynamic equilibrium.
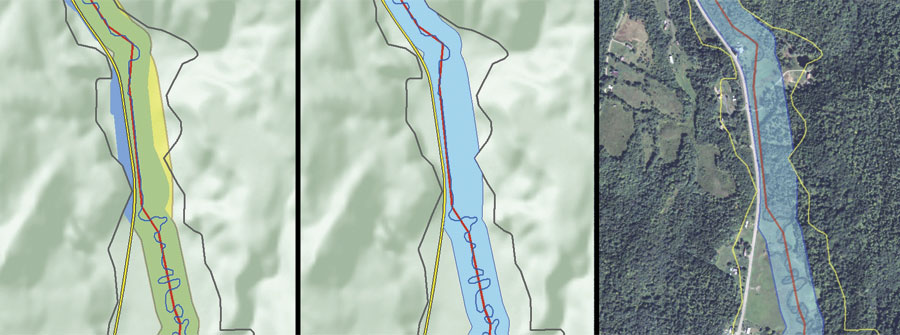
The appropriate channel multipliers buffered the meander centerlines, creating buffer polygons around them. This formed the initial river corridor. Where the valley walls pinched the corridor, the team clipped the corridor polygons. But in places where the valley walls pinched one side but left room on the other between the corridor and the valley walls, the team made additional buffers to maintain the corridor polygon width—thus discouraging development in spaces where the river might meander in the future.
With this, a natural river corridor—clipped only by valley walls—was delineated for each basin. Additionally, the team created an administrative river corridor that took into account major roads and railroads that will always be protected before and rebuilt after a flood or catastrophic erosion event.
Working Together to Avoid Erosion and Flood Hazards
The Agency of Natural Resources published the Vermont River Corridor layer on its Natural Resources Atlas website in January 2015. Now communities and their partners—including watershed groups, conservation districts, and land trusts—can map the areas that are most vulnerable to erosion and flood hazards.
“By developing and publishing a river corridor map that uniformly covers all streams and rivers, we avoid ad hoc decision making and allow the state and municipalities to move forward with certainty in adopting consistent statewide regulations,” said Kline.
The map is now the base GIS layer for regulatory actions under Vermont’s Flood Hazard Area and River Corridor Rule, which ensures that construction in flood hazard zones is safe and does not impair a stream’s natural flow. Additionally, municipalities that regulate land use in river corridors are eligible for increased state disaster assistance, so many of them are beginning to use the layer for flood resilience planning.
For more information, contact Heather Kennedy, GIS data analyst and information coordinator for the Vermont Department of Environmental Conservation’s Rivers Program.
