
Parking is hard to find in Washington, DC. The population—which topped 670,000 people in 2015—swells by 79 percent each workday, according to a 2013 study by the US Census Bureau. Not only do residents, commuters, and business owners all compete for the same spaces, but bicyclists, taxicabs, and public transportation need access to curbside areas as well.

When residents and business owners lodge complaints about the shortage of available street parking, their grievances filter down to the Washington, DC, Department of Transportation (DDOT). Managing the intense demand for parking and curbside spaces in this urban core is complex and requires understanding the current parking supply, as well as the prevailing management plan. Knowing the locations of parking meters, restricted parking zones, parking spots, and signs is a critical part of improving the availability of Washington’s limited curb space.
Whereas DDOT staff used to have to walk the streets and alleyways in the district to count parking spaces, correct parking meter locations, and inventory street signs, this can now all be done from DDOT’s offices. By integrating the ArcGIS platform with high-resolution, highly accurate ground-based imagery, DDOT staff can see what’s happening on the ground from their computers.
Desktop Diagnoses
For years, DDOT received complaints from citizens, district council members, and business owners about insufficient parking in various Washington neighborhoods, including Georgetown, Dupont Circle, Kalorama, and Eastern Market. Until recently, DDOT had to react to these complaints without having sufficient data to thoroughly understand the situation.
In late 2014, Benito O. Pérez, DDOT’s parking/curbside management and operations planner, began a project to gain adequate information on parking availability. Using ArcGIS Online and imagery from Esri partner CycloMedia Technology, Inc., Pérez developed a workflow to audit curbside parking restrictions and inventory off-street parking.
CycloMedia captured 100-megapixel, 360-degree panoramic views of roadways and alleys at five-meter increments. This georeferenced panoramic imagery—called GeoCycloramas—is high resolution, so staff can see details such as the text on signs and the identification numbers on poles and fixtures. The images from CycloMedia are free from distortions, and every pixel has a known location.
To perform analysis, users can overlay data layers—such as subsurface information or the locations of hydrants, utility poles, or other fixtures—onto GeoCycloramas in ArcGIS Online. Because every pixel has an accurate location, users can make visual references; verify the accuracy of existing datasets; collect new features; and, ultimately, better coordinate fieldwork activities.
“Esri-integrated images from CycloMedia allow us to augment our desktop analysis with a snapshot of reality, which, in turn, streamlines data validation when we do go out in the field,” said Pérez.
DDOT staff can now quickly and easily document accurate asset locations, view field conditions, measure assets, and update infrastructure data.
Auditing Parking
For the audit, staff used ArcGIS Online to view GeoCycloramas in the problem areas to inventory all available parking facilities, whether public or private. Having access to alleyways enabled DDOT to document private parking garages and pads that are tucked away behind buildings, in addition to those visible from the road. On the web map in ArcGIS Online, staff recorded the parking spot locations for each block segment in the neighborhoods being reviewed.
From this, DDOT came up with web maps that showed curb uses and parking availability throughout Washington’s most crowded areas. What’s more, these maps could be shared with stakeholders to give them a clear picture of the parking situation. For Georgetown, for example, DDOT combined the data in the web maps with other information—such as vehicle registrations and the number of residential permits that have been issued—to show the accurate count of parking spaces and the total number of permit holders in that zone. This allowed DDOT to compare local supply with local demand and determine the number of parking spots left for nonresidents.
Inventorying Street Signs
DDOT also handles requests to replace missing or damaged signs, including traffic control signs, parking markers, and street signs. When a request to change or update signage comes in, DDOT has to confirm the conditions in the field before it can accept or deny the request. This also helps determine how to execute the change.
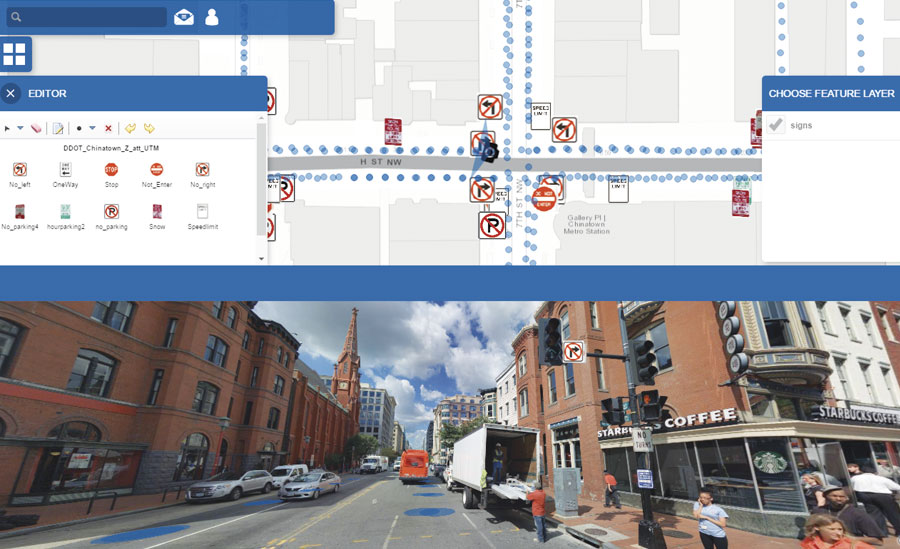
To obtain an accurate inventory of street signs, Pérez enlisted the help of James Graham, a GIS and applications manager in the DDOT office of information technology and innovation, to complete a street sign database using CycloMedia’s Street Smart app for ArcGIS, which works in ArcGIS Online.
Users collect data in Street Smart by clicking on a location in a web map to open the nearest GeoCyclorama. They then edit the sign feature class directly on the GeoCyclorama, capturing an x-, y-, and z-coordinate for each feature and entering its attributes.
Viewing GeoCycloramas on their desktops allows staff to gauge a number of factors, including
- Seeing whether existing signs have conflicting messages.
- Figuring out the location and type of support structures—such as metal poles, walls, or wooden masts—available for affixing a sign.
- Seeing if there is enough free space in the area to support another sign.
- Evaluating any safety issues caused by current sign placement (a sign allowing curbside parking too close to an intersection, for example).
- Determining whether safety issues will arise because of the requested sign change.
- Ensuring that there is an appropriate amount of space between signs or between signs and other infrastructure.
Once staff have performed the necessary inspections and determined that a new sign is needed, they view GeoCycloramas again in Street Smart in ArcGIS Online to find and capture the coordinates for where the new sign should be installed, as well as the location for a new support structure, if needed.
Although the sign inventory is incomplete as of yet, it is already reducing the number of field visits that sign crews need to make and minimizing turnaround time, which help to better manage parking in Washington. Once the inventory is finished, DDOT anticipates that it will be able to eliminate at least 80 field visits per month, according to Graham.
Working More Efficiently
Staff at DDOT have found that using CycloMedia’s panoramic imagery in conjunction with ArcGIS Online has considerably enhanced workflows in the field operations division. In the past, sign crews sometimes found that they were sent to the wrong location to do a sign check, or when they were installing new signs, encountered conditions in the field that diverged from what they had anticipated.
“With the [GeoCyclorama] data, staff can perform a detailed prework field inspection, letting them know exactly where to go and exactly what to do once they get there,” said Graham.
Adding GeoCycloramas to the ArcGIS platform has significantly increased productivity at DDOT and improved outcomes. Staff can now view assets at the street level and edit associated features in ArcGIS geodatabases without having to leave their desks. Being able to clearly see conditions on the street, in combination with GIS datasets, not only reduces the need for field visits but also streamlines GIS workflows by integrating imagery exactly where it is needed.
For more information, email DDOT’s GIS and applications manager, James Graham, GISP.
