
Survey123 for ArcGIS Helps the City of Aurora Identify Those in Need

Every year in late January, communities across the United States conduct a count of their local homeless populations. These one-night snapshots are reported to the US Department of Housing and Urban Development (HUD) to provide a better understanding of the scope of homelessness and to measure progress in the effort to reduce it.
In Colorado, the City of Aurora’s new homelessness program director, Shelley McKittrick, found a way to get a more accurate count for this year’s point-in-time homeless census. She worked with Aurora’s GIS team, led by GIS coordinator Bill Keever and GIS specialist Ryan Witsell, to switch from a paper-based system to a map-based app. Using a survey built with Survey123 for ArcGIS, the city—which has a population of about 360,000—identified over 100 more homeless people than the 2016 count recorded and easily documented each person’s location.
“We’re not trying to sweep our homeless people away,” said McKittrick. “We are trying to invite them in and provide them with services. A dot on a map is not going to help somebody. But it will help to put a dot on a map where we can find someone and offer them socks and food and bring them in for a meal or to see a medical provider.”
Creating the Map-Based App
Building the app was simple. McKittrick sent Witsell a list of questions for the count, and then he used Survey123 to spin them up into a web-based survey.
“The easy-to-use [user interface] made it a quick process to drag and drop certain question templates; indicate whether [the questions] were multichoice, free form, etc.; and determine whether or not the question was required,” recalled Witsell. “In all, the process took me a little over a half an hour.”
Less than an hour later, McKittrick’s team was out in the field testing the survey. Since using the app didn’t require a download, all they had to do was click a link using their mobile devices, and it took them straight to the survey.
Conducting the Count
On the night of the count, Aurora’s 40 volunteers loaded the survey onto their smartphones. McKittrick and Aurora’s GIS team conducted a 10-minute training on how to use the survey just before deploying the volunteers into the field. Volunteers then rode around their designated areas collecting data on a no-contact basis, meaning they recorded just what they saw.
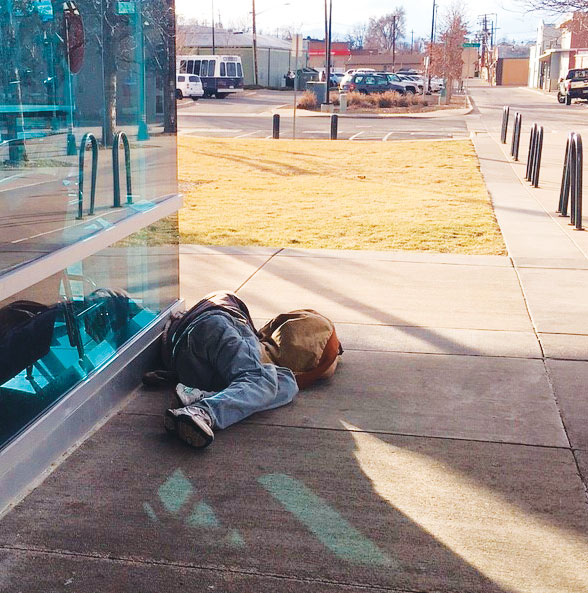
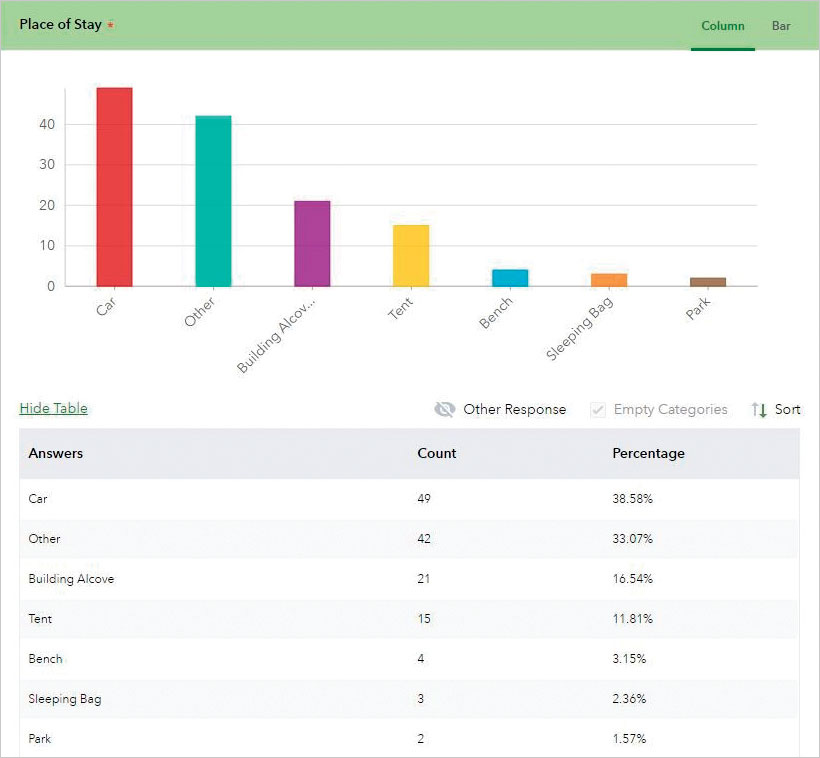
The survey form included categories for what type of place each person was staying in, such as a tent, a car, a sleeping bag, a bench, a building alcove, or a park. It also asked about each person’s relative age and whether he or she was inside or outside a business district. Additionally, given that the volunteers were largely social services providers, people experiencing homelessness, city council members, police officers, parks and recreation workers, and faculty from the University of Colorado, the survey also asked whether the person collecting the data was familiar with the homeless individual.
At the end of each entry, surveyors dropped a pin on the map to indicate where the homeless person was located and provided notes as to which services—such as medical care, food, and showers—would be most helpful.
Survey data was updated in real time on the city’s homeless census, which saved workers time and effort.
“Real-time GIS data helped ensure that the city maximized its resources, as census takers could tell at a glance where other teams had or had not been already,” Witsell said. “As soon as they identified someone, it would appear on the map that the location had been visited.”
Once the survey was finished, the GIS analysis helped identify pockets of homelessness that had previously gone undetected. Sending that data to HUD will inform the agency as well as help the City of Aurora reach out to people in need. The city is also sharing its information from the count with the Metro Denver Homeless Initiative, which will collate and analyze data from throughout the region to address homelessness on a wider scale.