
Oakland, California, lies directly across the bay from San Francisco. During the California Gold Rush in the mid-18th century, it served as the main staging point for miners and cargo traveling between the Bay Area and the Sierra foothills. Today, the city continues to serve as a major cargo terminus, and its seaport is the fourth busiest container port in the United States.
Due to the economic opportunities provided by the Gold Rush, the city was a destination for immigrants looking for greater prosperity. As a result of this and successive migrations, Oakland is now known for its ethnic diversity, with significant populations of African-American, Hispanic, Asian, and Caucasian residents. While valuable from a cultural perspective, this poses certain challenges for local government, particularly the Oakland Unified School District (OUSD), which must accommodate the diverse needs of its students, who speak more than 70 languages at home.
OUSD includes 61 elementary schools, 16 middle schools, 20 high schools, three K–8 schools, and one 6–12 school, as well as special education, independent study, and early childhood education centers. It is the 70th largest school district in the United States, and there are about 38,000 students in its K–12 programs. Chronic absenteeism is a major concern for the district, with nearly 40 percent of students in the East Oakland area dropping out of high school before graduation. OUSD works with the Urban Strategies Council (USC), a nonprofit organization in Oakland, to collect and analyze data related to school attendance and other social issues in the city.
Implementing a Community Data Portal with ArcGIS for Server
USC has used ArcGIS software for more than 20 years, applying it to a wide range of urban policy and reform initiatives affecting Alameda County, where Oakland is located, including health care services, affordable housing, violence prevention, education analysis, urban planning, disaster mitigation, and school absenteeism. For example, it recently launched InfoAlamedaCounty Map Room, a free data portal that provides community access to public datasets for research, application development, civic engagement, and analysis.
Due to the enormous amount of information stored in the county’s data warehouse, which needs to be made available to those organizations doing local research, ArcGIS for Server has greatly benefited the county’s data portal project. With ArcGIS for Server and REST APIs, the county can take very detailed Alameda County data about individuals that is collected through special nondisclosure agreements and aggregate it to a safe level for general use by local government agencies, such as OUSD, and the general public.
Tackling Chronic Absenteeism
USC and OUSD are using ArcGIS to analyze the social and economic factors that dominate those areas with high rates of absenteeism to better determine why students aren’t attending school and what needs to be done to increase attendance.
“Statistics show that when a student is absent from school 10 percent of the time, which we define as chronic absenteeism, that student is much less likely to graduate, and this will affect the rest of his or her life,” says Steve Spiker, director of research and technology for USC. “Our goal is to help foster a culture of attendance within the Oakland public school system.”
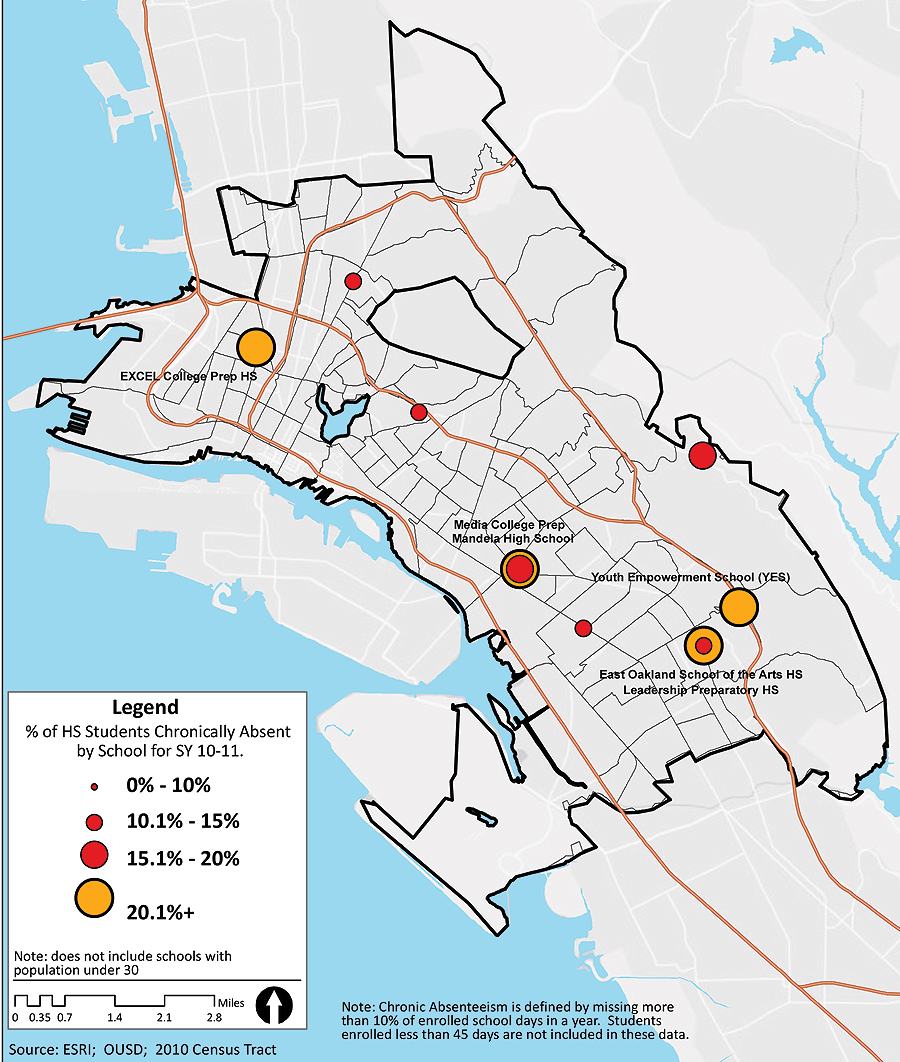
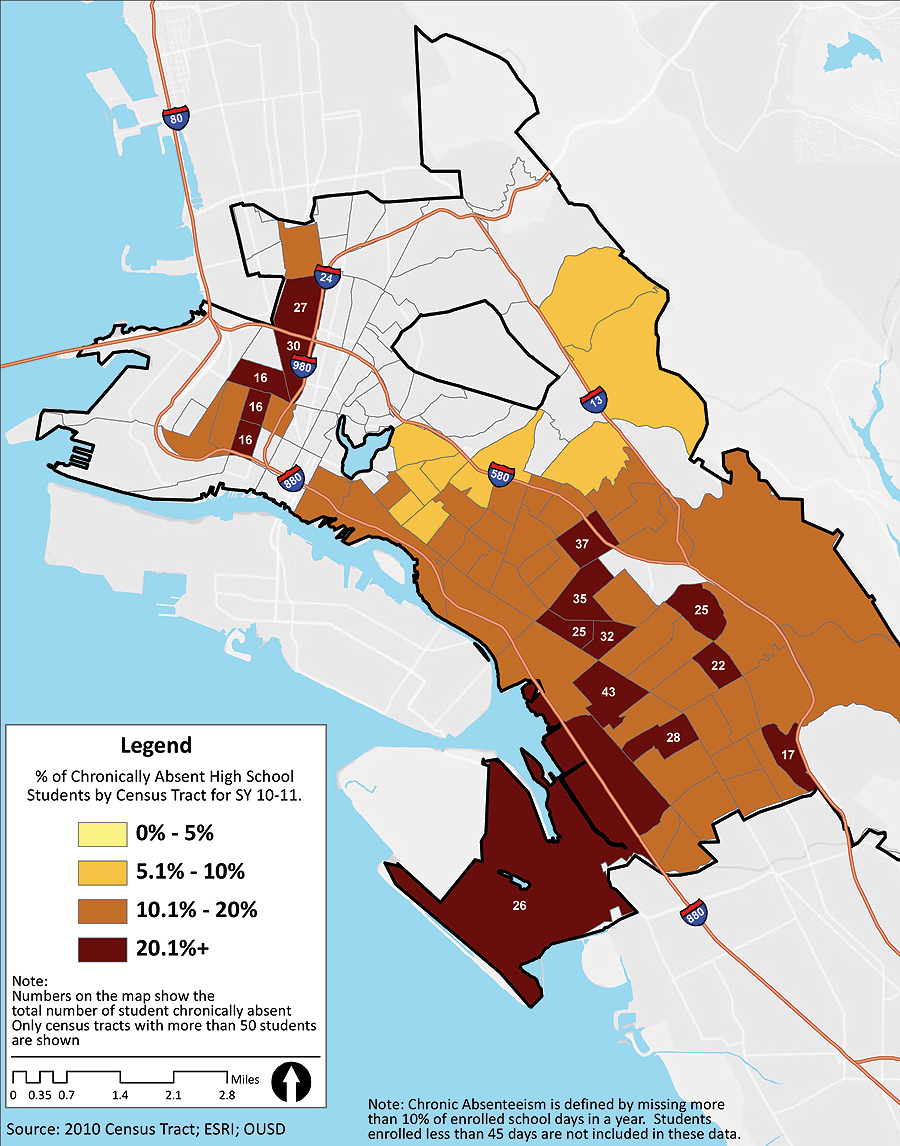
To better understand student absenteeism in Oakland, data about all OUSD students is geocoded and then processed with ArcGIS to determine how many days of school each student has missed and where the chronically absent students live. The 38,000 data points representing the students are aggregated so that individuals can’t be identified. The data is then mapped to examine absentee variations across the school district. This can be overlaid with census data to determine if some geographic areas and/or population groups are more prone to absenteeism than others and, if so, why. In addition, this data can be examined over time to see if the areas with historic chronic absenteeism are getting better or worse.
“Performing an analysis of student absenteeism with GIS allows us to present the results on a map that engages the community on an emotional level that can’t be achieved with tabular data,” says Spiker.
Aligning Resource Allocation with Community Partners
USC and OUSD have formed a partnership, which has increased the district’s use of USC’s geospatial datasets. OUSD used ArcGIS for several years for administrative purposes, and its Research, Assessment and Data (RAD) department developed the Opportunity Mapping application to serve as a decision-support tool for district administrators and policy makers.
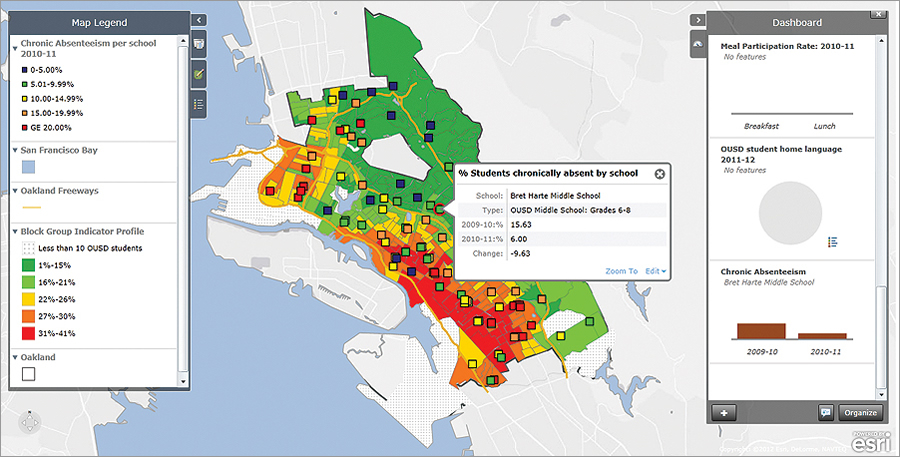
The application uses data from USC, as well as OUSD’s Healthy Kids, Healthy Oakland data framework. Mapping categories include school sites and enrollment, graduation rates, school-based food services and free and reduced lunch, academic performance and physical fitness assessment, chronic absenteeism, demographic ethnicity, early childhood education and campus health centers, community resources, health and wellness/life expectancy, and vacant housing.
“Mapping these indicators and freely distributing our analyses helps district leaders and school communities see where the gaps are in the school district’s educational initiatives,” says Susan Radke, a consultant for OUSD RAD. “It is a new way for OUSD to use place-based data to drive strategies and decisions, such as the allocation of resources to places and students where the need is greatest. It also helps community partners align their resources with the school district, which is especially important in a time of diminishing resources throughout the entire system.”
Down the Road
Radke says that the next iteration of the Opportunity Mapping application will include an expanded set of indicators, such as measures of student health, healthy neighborhood indicators (fresh food locations) that have been ground truthed by students, crime analysis, and school-based analysis of career paths. The architecture for the application will be migrated to a fully developed ArcGIS Online cloud-based web service, which will afford greater customization via APIs.
For more information, contact Susan Radke, mapping analytics specialist, Quality, Accountability, and Analytics, Oakland Unified School District, or Steve Spiker, director of research and technology, Urban Strategies Council.
Related Podcast
The State of GIS in Education
David DiBiase, Esri director of education, talks about the integration of GIS in education, as well as new areas where geospatial technology is being applied. Listen to the podcast. [09:00 | 8 MB]