Map-based visualization aids green retrofit campaign
San Francisco’s Department of the Environment (SFE) recently completed a successful campaign to improve energy efficiency in city homes with the help of Community Analyst, Esri’s web-based mapping and reporting tool. With up-to-date population and segmentation data, Community Analyst gave the department a granular perspective on San Francisco residents that resulted in more effective use of limited marketing funds, resulting in greater participation in the program.
Cast a Big Net
In 2008, the San Francisco Board of Supervisors set a target to reduce greenhouse gas emissions to a level 80 percent below 1990 levels by 2050. With residential housing accounting for 22 percent of the city’s greenhouse gas emissions, reducing energy consumption in the home has never been more important. To reach that goal, San Francisco participated in Energy Upgrade California, a statewide energy management initiative with a two-pronged mission to educate California property owners about energy conservation and make energy upgrades more afforable.
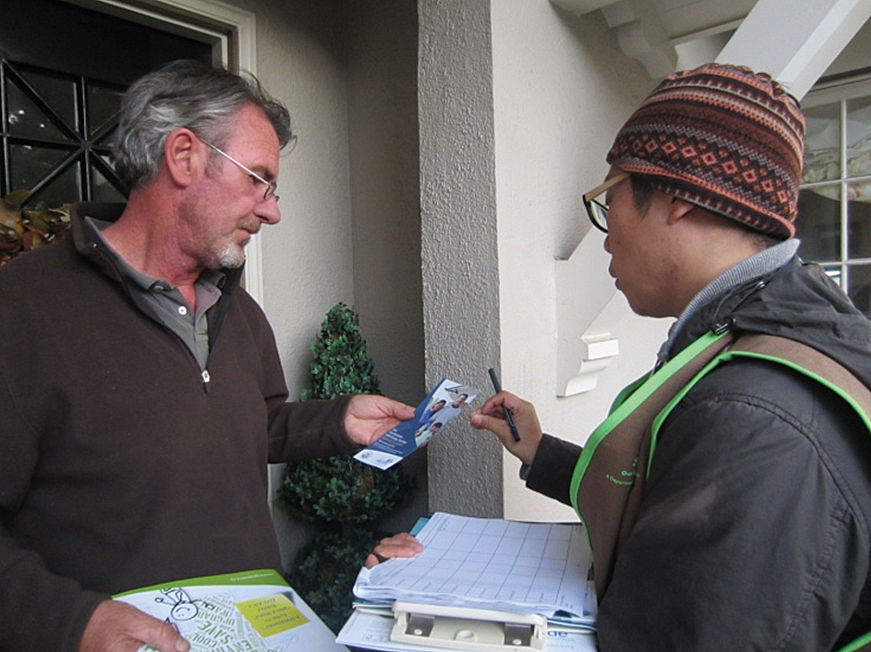
To increase the number of energy-efficient homes, SFE developed a program to incentivize the city’s homeowners to invest in energy retrofits that would be costly. Because SFE had a very limited marketing budget, it needed a plan to promote the program to those homeowners who would be most likely to undertake such a major commitment. The department decided on a multifaceted outreach campaign that would begin with direct mail and citywide advertising and conclude with old-fashioned door-to-door outreach.
The department achieved widespread awareness of the program through newspaper ads, signage, and leaflets in official city mailings. The city used messaging with seasonal context. Ads declared “It’s Outta Here . . .”—a reference not only to San Francisco’s World Series champion Giants but also to precious heat escaping from homes during this coastal city’s damp winters. The department estimated that at least 250,000 residents would see the ads for Energy Upgrade California. “We needed to introduce Energy Upgrade California to the public,” said Luke Easdale, Marketing and Outreach Coordinator for the Energy Program. “We determined the most effective way to initially raise program awareness was through citywide advertising and marketing channels.” Although California also offers Energy Upgrade California services to multifamily homes and commercial property owners, the department decided to market to single-family homes to simplify its demographic analysis.
Find the Niche Market
Since not all residents are homeowners and not all who are homeowners have the means or motivation to retrofit their homes, more targeted marketing was needed to complement the citywide awareness campaign. The department needed to understand San Francisco both geographically and demographically so it could focus efforts on neighborhoods with the highest potential for program participation. This approach enabled the team to allocate its limited financial and volunteer resources more efficiently. Data on demographic and lifestyle characteristics—income, retail spending potential, utility costs, environmental and political group participation, media preferences, and spending patterns—could provide key insights and identify the areas that would be most receptive to the program. “The complexities of Energy Upgrade California—San Francisco are difficult to succinctly summarize in widely distributed collateral,” said Easdale. “Ads and bus stop signs should be used to drive overall awareness, but they must be complemented by informed local outreach methods to ultimately be effective.”
Using Esri Community Analyst, which integrates demographics and Esri Tapestry Segmentation data, the team could locate and market the program to the most receptive residents. The Tapestry Segmentation system divides US residential areas into 65 distinct segments based on socioeconomic and demographic characteristics to provide an accurate, detailed description of US neighborhoods. It can help to identify targeted markets, define product and service preferences, and tailor marketing messages to fit specific audiences. Characteristics, such as income, net worth, and spending patterns, can be useful in predicting consumer behavior. Tapestry Segmentation data is available as reports and maps in Community Analyst and other Esri business intelligence products.
“From the outset, we wanted a simple visualization and reporting tool that would present the data accurately and help drive our interactive campaign,” said Easdale. “A map-based app would give us an overview of the communities that we should visit, which was absolutely essential given our resources.”
Applying Insights
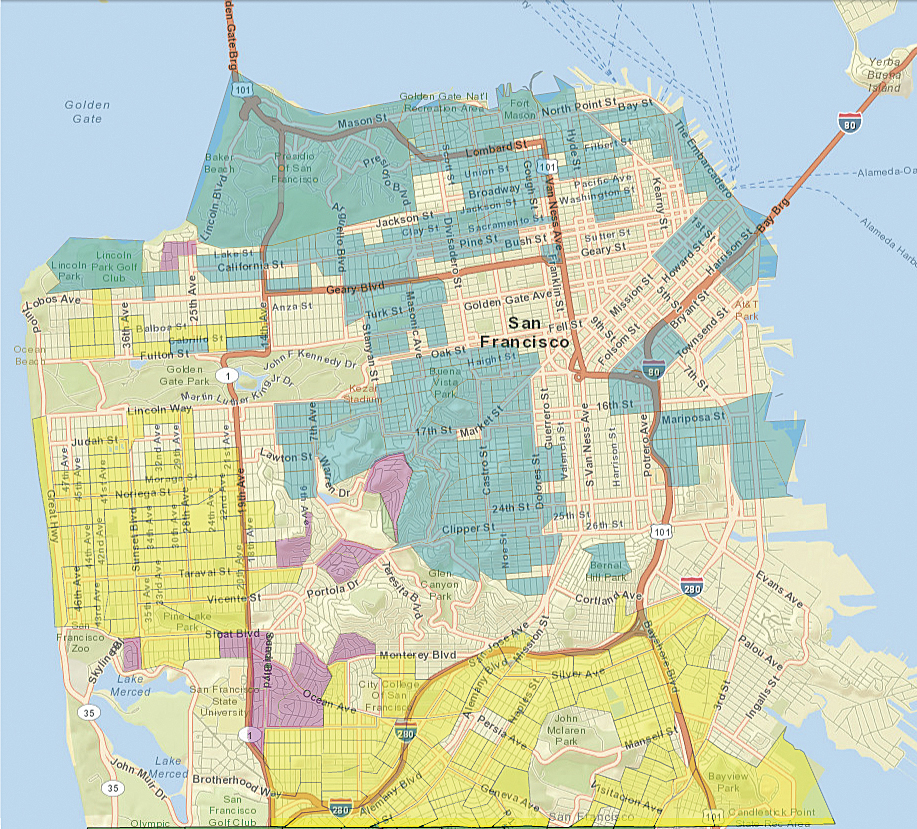
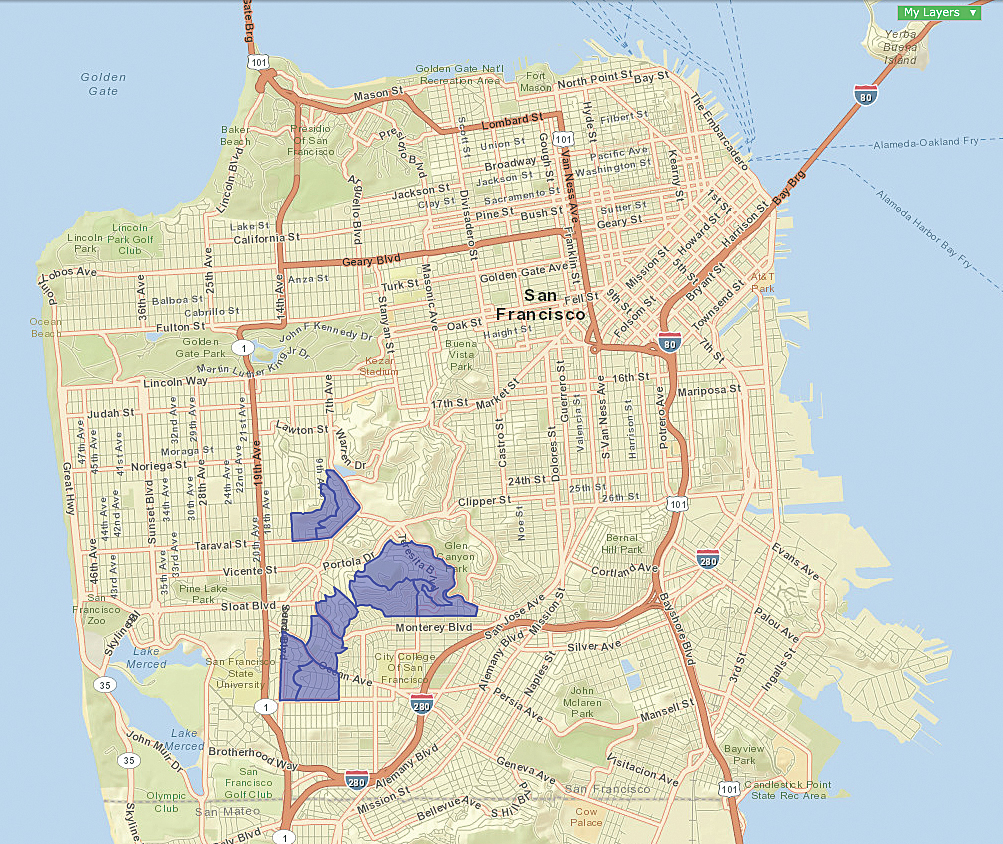
Using Tapestry data in Community Analyst, Easdale identified areas to focus on during the final interactive campaign for Energy Upgrade California. To learn more about the types of people who might be interested in the offer, the team started by plotting the locations of residents who’d bought Energy Upgrade packages in previous years in Community Analyst. Once plotted, Easdale looked for clustering and commonalities shared by these completed projects. Tapestry identified Connoisseurs segment neighborhoods as the primary target lifestyle group based on their rate of participation in past programs. Residents in these neighborhoods tend to be wealthy, well-educated, married couples who own their homes and engage in civic activities.
Because Community Analyst displays data geographically, the team was able to see that Connoisseurs neighborhoods were concentrated in San Francisco’s District 7. Clearly, that was where teams should concentrate the door-to-door campaign. The team used Community Analyst to map individual residential addresses and organized customized walk-sheets so staff could save time and walk continuously from address to address. Community Analyst also revealed potential in Laptops and Lattes and Pacific Heights neighborhoods. Community Analyst showed concentrations of these segments in five distinct districts, giving even more focus and direction to interactive outreach planning.
Careful crafting of scripts for the door-to-door presentations and the offer of deep discounts for retrofit projects made the final targeted phase of the campaign more effective. Packages consisted of retrofitting insulation and replacing antiquated water heaters; gas furnaces; and other old, inefficient appliances.
The high cost of these modifications meant that even residents of Tapestry targeted neighborhoods who could afford the packages would need incentives. To sweeten the deal, staff offered rebates of up to $5,000 per home. “The high out-of-pocket cost of an energy upgrade was identified as one of the largest barriers to homeowner participation,” said Easdale. “Incentives attracted homeowners who didn’t have the means to cover an entire upgrade.” Besides financial factors, the department’s route planning was further refined by considering characteristics such as environmental group participation.
Surpassed Expectations
Map-based demographic and lifestyle research tools facilitate understanding of neighborhoods and are essential in wide-scale marketing campaigns such as Energy Upgrade California—San Francisco. Maps helped the department instantly identify where outreach teams should go.
Thanks to its extensive preliminary research and staggered marketing, the department was able to exceed its expected sales by 81 homes. “Community Analyst, demographics, and Tapestry Segmentation data provided quantifiable reasoning to verify which areas and people to target,” said Easdale. “Focused outreach informed by accurate demographic information and authoritative visual evidence proved to be a powerful lead generator for us.” Reuben Schwartz, who manages the department’s residential energy efficiency programs, added, “Correlating energy consumption to both geographic and demographic traits of our residents is critical to our success. Esri’s tools were invaluable tools to help us make those connections. We hope to expand use of these tools to more neighborhoods in the city.”