Although 3D web apps provide stunning visualizations and a unique way of interacting with spatial data, the thought of building a 3D app might be a little intimidating.
Perhaps you don’t know where to find or create 3D data or the technology seems sophisticated, and you aren’t sure you are ready to learn a new technology.
What you may not know is that you already have the data, styling tools, and technology you need to build fully functional 3D web apps. And the best part—you can essentially use the same skills you use to build 2D apps to build 3D apps.
Style Your 2D Data for a 3D Experience
You don’t actually need 3D data to build a 3D app. You can style your 2D data so it works well in a 3D environment.
ArcGIS Pro and Scene Viewer (available with ArcGIS Online and ArcGIS Enterprise) provide styling tools that you can use to style 2D data for 3D and then save and publish it as a web scene that you can use in a web app. You can also configure the styling manually using the ArcGIS API for JavaScript, which provides all styling options to you.
Symbols
Rather than visualize points with basic 2D symbols, you can use realistic 3D symbols. For example, represent trees with 3D tree symbols or street sign locations with 3D street sign symbols. You can represent points as simple volumetric point symbols such as spheres or cylinders or represent lines as tubes.
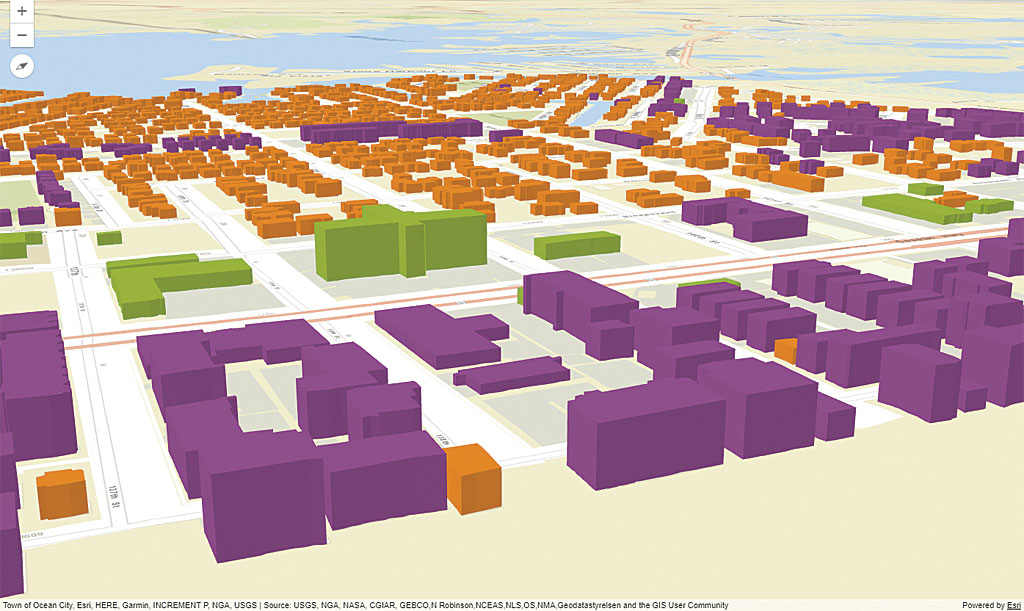
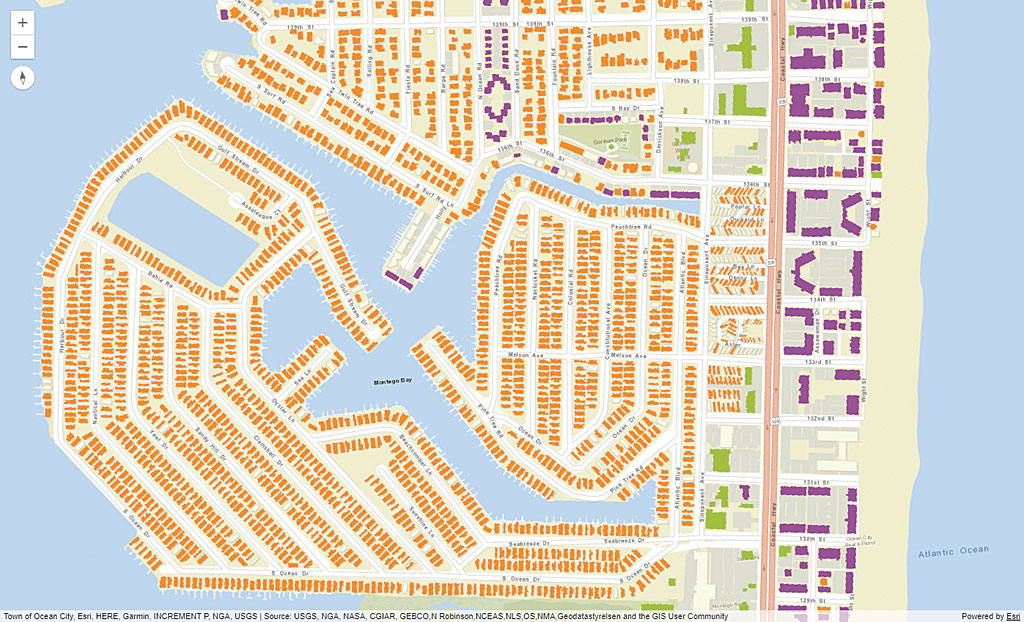
Using the ArcGIS API for Javascript, polygon data in 2D can be extruded using a height value in the attribute data. This is often done with building footprints. In 2D, building footprints are drawn on the ground. If your data also includes building heights, you can add that data to a 3D scene and extrude the buildings by height value for each building so they look like 3D buildings.
Data-Driven Visualization
You can create data-driven visualizations using Smart Mapping to style your 3D layers as you do when mapping in 2D. The same concepts used in 2D are applied in 3D, only now you have another dimension to work with.
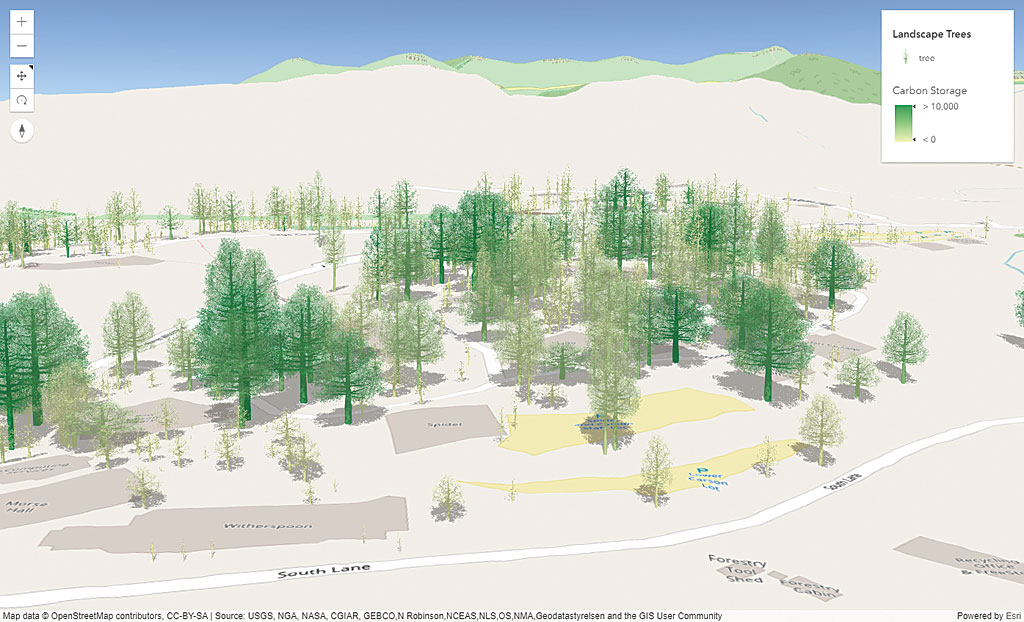
Attribute data can be used to drive symbol properties such as the color or size of 3D symbols. For example, when symbolizing tree data in a 2D map, you might symbolize trees using a circle icon, set the color to thematically represent the amount of carbon dioxide each tree sequesters, and set the diameter of the circle to be driven by the value of the diameter of the tree canopy.
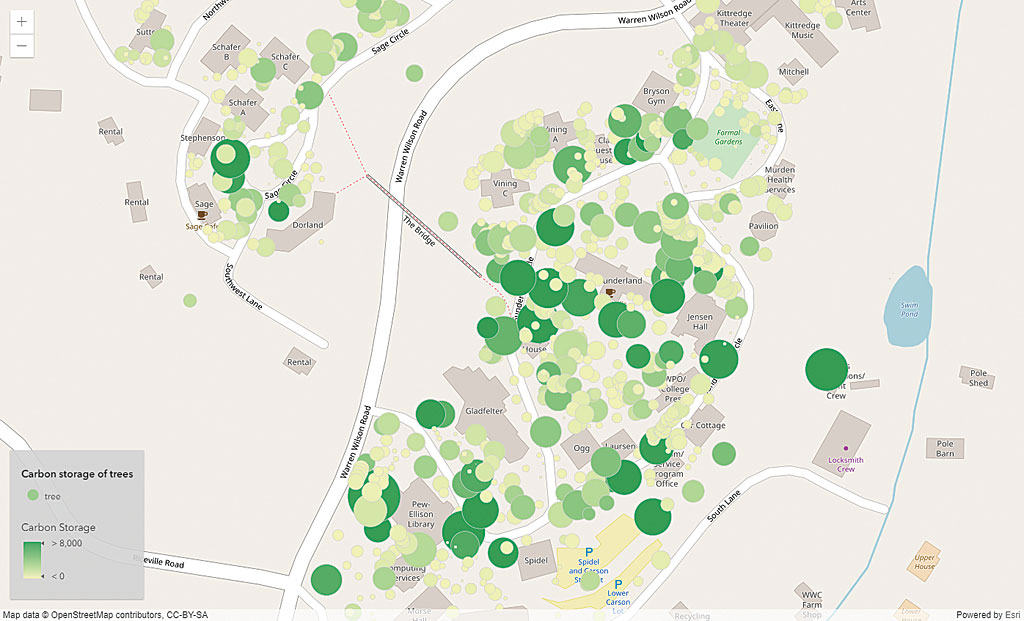
When representing the same data in 3D, you can represent each point with a realistic 3D tree symbol rather than a simple icon. The width of the realistic tree canopy can still be driven by the attribute values, but tree height and the trunk width can also be driven by attribute data to accurately represent the tree in 3D.
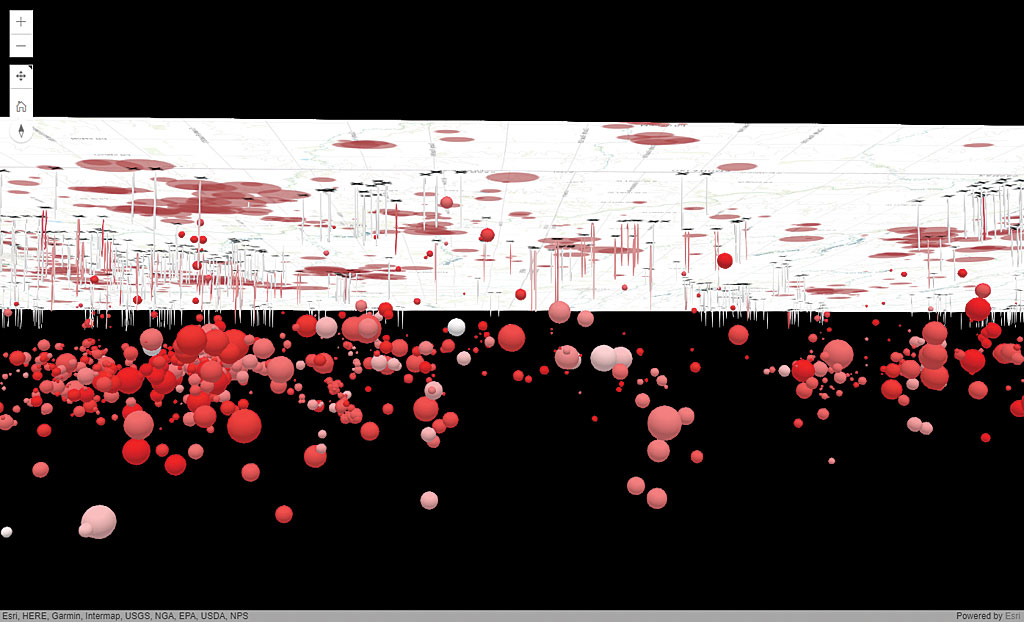
With the ArcGIS API for JavaScript, you can also build 3D scenes below as well as above the ground surface to show the location and spatial relationship of features such as pipes, wells, and earthquake locations by using attribute values in the data to extrude points below the surface. To play around with subsurface visualization, see the code sample “Create a local scene” in the ArcGIS API for JavaScript documentation at js.arcgis.com.
Using Elevation to Make a 3D Scene Look Realistic
To make a 3D scene look realistic, you can add ground elevation to the scene rather than display a uniformly flat surface. The easiest way to do this is to use Esri’s World Elevation layer, which is available from ArcGIS Online.
This elevation layer is a global collection of multiresolution and multisourced elevation data. It includes the best publicly available data and community-contributed data available at resolutions that range from 1,000 meters to 3 meters. This layer is added to web scenes by default in Scene Viewer, but you can choose to turn it off or use your own elevation layer.
If you create your 3D scene programmatically in the ArcGIS API for JavaScript, you can simply specify that you want to use the World Elevation layer for ground elevation using the code in Listing 1.
If you have high-resolution elevation data for a specific area that you want to use in your application, you can use it for that area and use the World Elevation Service for the rest of the globe.
Styling Considerations When Displaying Elevation
var map = new Map({
    basemap: "streets",
    ground: "world-elevation"
});
Listing 1
When you are including elevation in your app, you don’t want your data to get buried. It should be draped over the landscape, and unless you configure it otherwise, this will happen by default for all geometry types.
Another consideration has to do with the visibility of points when interacting with a 3D scene. If point symbols are drawn flat on the ground, it might be hard to see them as you navigate around the 3D scene. To mitigate this, use billboard symbols that almost float on the ground and always seem to face the viewing angle. Another option is to use line callouts (or leader lines) from icons or labels that indicate the location of each feature. This is a great option for displaying points of interest in a scene that either has varying elevations or buildings or other 3D objects that range in height and obscure point data.
Build Your 3D Web App
You have multiple options when it comes to building your 3D web app. You can use Scene Viewer, Web AppBuilder for ArcGIS, or the ArcGIS API for JavaScript.
Right from Scene Viewer in ArcGIS Online, you can create a web app that consumes your web scene by choosing Share > CREATE A WEB APP from the Share pane. You are then presented with a selection of web application templates that you can use to configure the app with styling and other preferences specific to each application. Choose a template and click CREATE A WEB APP. It will automatically be saved to your Content and shared with everyone. Go to your Content, open the item, and configure the options available for that template. Save your changes and launch the app.

Alternatively, from the Share > CREATE A WEB APP workflow, you can choose Web AppBuilder for ArcGIS to create your 3D web app. Web AppBuilder for ArcGIS lets you select a theme from several layout options and styles and add specific widgets to your app. When you’re done configuring the app, save and publish it.
If you are a developer, you can create a custom 3D web application using the ArcGIS API for JavaScript. Because this will be a purely custom implementation, you can design the exact experience you’d like your app to provide. Because the configurable web templates available from Scene Viewer and Web AppBuilder for ArcGIS are built on the ArcGIS API for JavaScript, you can build similar capabilities into your application. Extensive documentation and samples to help you develop your app are available at js.arcgis.com.
Apply Your 2D Programming Knowledge
If you are familiar with developing a 2D app using the ArcGIS API for JavaScript, you can often apply the same programming patterns when developing a 3D web app. There are many cases in which the same code can be shared between a 2D map and a 3D scene. Some developers choose to build apps that offer both a 2D and 3D view.
3D apps can be just as interactive as 2D apps. Your 3D web app can have pop-ups, you can filter and query features based on the user’s criteria, and you can access server-side capabilities such as geocoding and routing. The interaction you can build into a 3D app, combined with the rich experience that naturally comes with navigating data in 3D, can make a 3D app feel even more interactive than a 2D app.
What Are You Waiting For?
Play around with Scene Viewer using your data or any of the millions of datasets accessible in ArcGIS Online. A few of the many resources available to help you get started with your 3D web app are listed under 3D Resources. Let the fun begin!
3D Resources
- ArcGIS Online Help topic “Creating 3D web apps using configurable app templates”
- Web AppBuilder for ArcGIS documentation
- ArcGIS API for JavaScript samples
- Esri training on the JavaScript API
About the authors

Julie Powell