New tools to focus map content
ArcGIS Online is ever evolving with new imagery, updated basemaps, and expanding functionality. Three new enhancements to the ArcGIS.com map viewer will give you more control over how your maps and associated information are displayed. Now you can set visibility ranges, create filtered views of feature layers, and display attribute table information for layers.
Setting Visibility Ranges
If a layer is turned on in the table of contents, the ArcGIS.com map viewer will draw it even if the current extent makes it difficult to see detailed information at that scale. Although you could turn off the layer at that point, this is cumbersome, especially if you change the map scale often as you work.
-
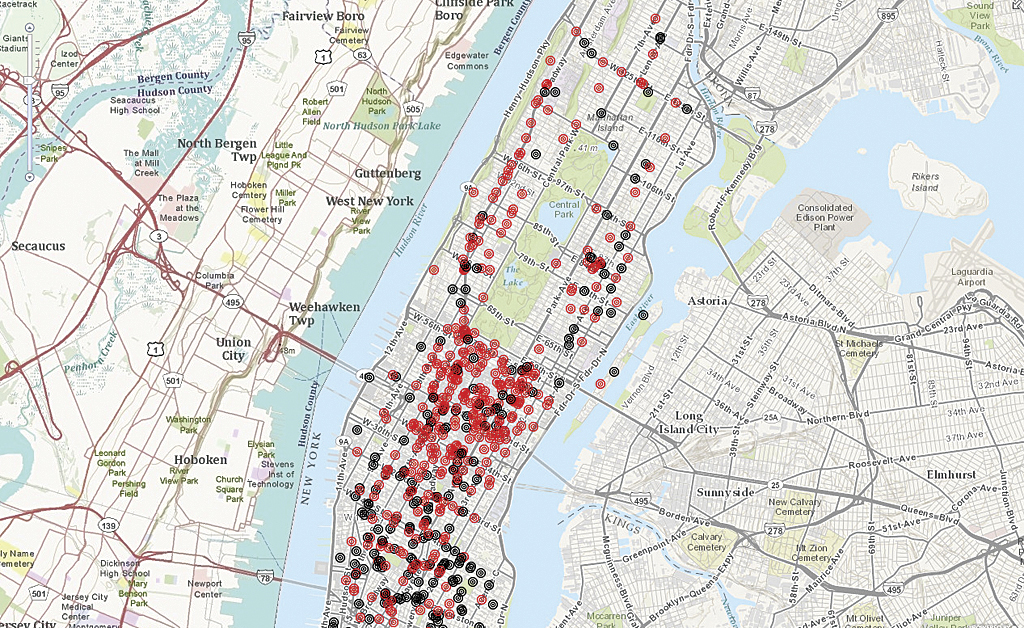
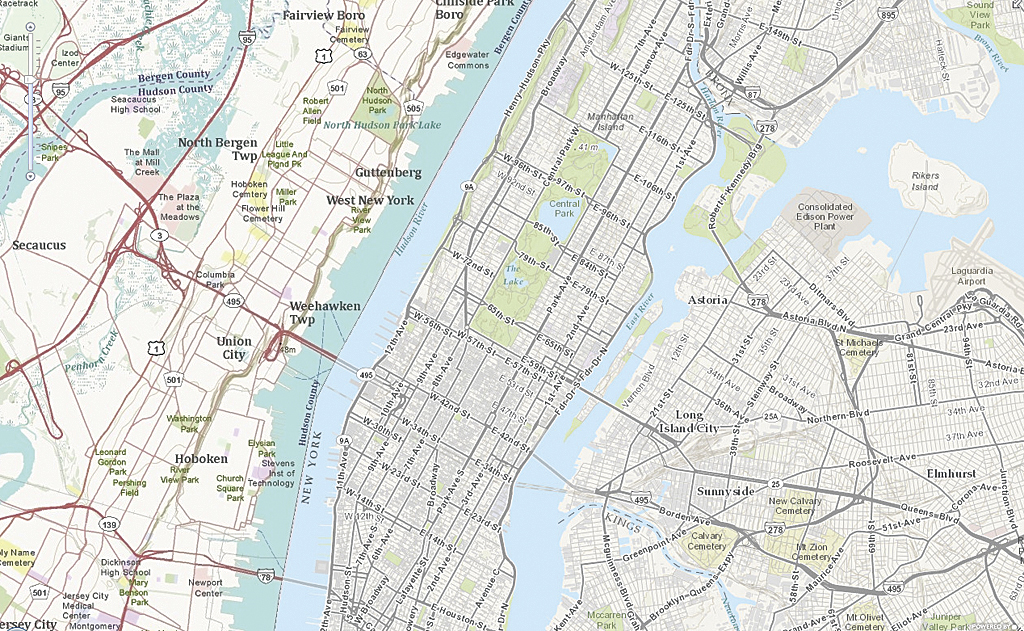
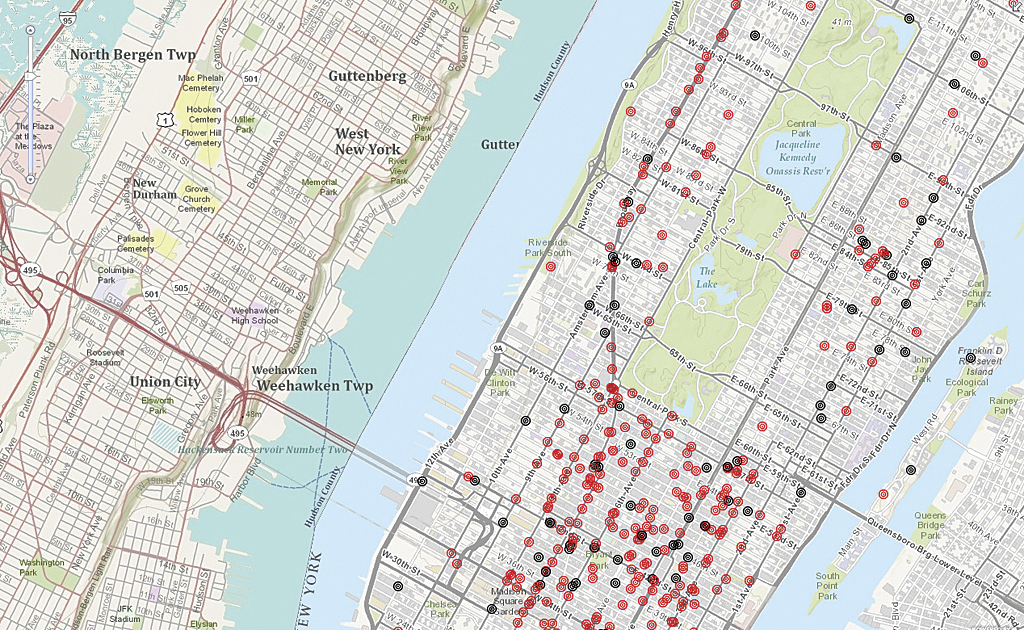
Figure A. Clarify the map's message using visibility ranges to show symbols at an appropriate scale (main). Default settings display symbols at all scales (A) while visibility settings turn off symbols (B) until the map is sufficiently zoomed in (C).
Now, you can set a scale range for each layer you own in your map. This visibility property is saved with the layer so it will display in the same scale range anytime it is used in a web map.
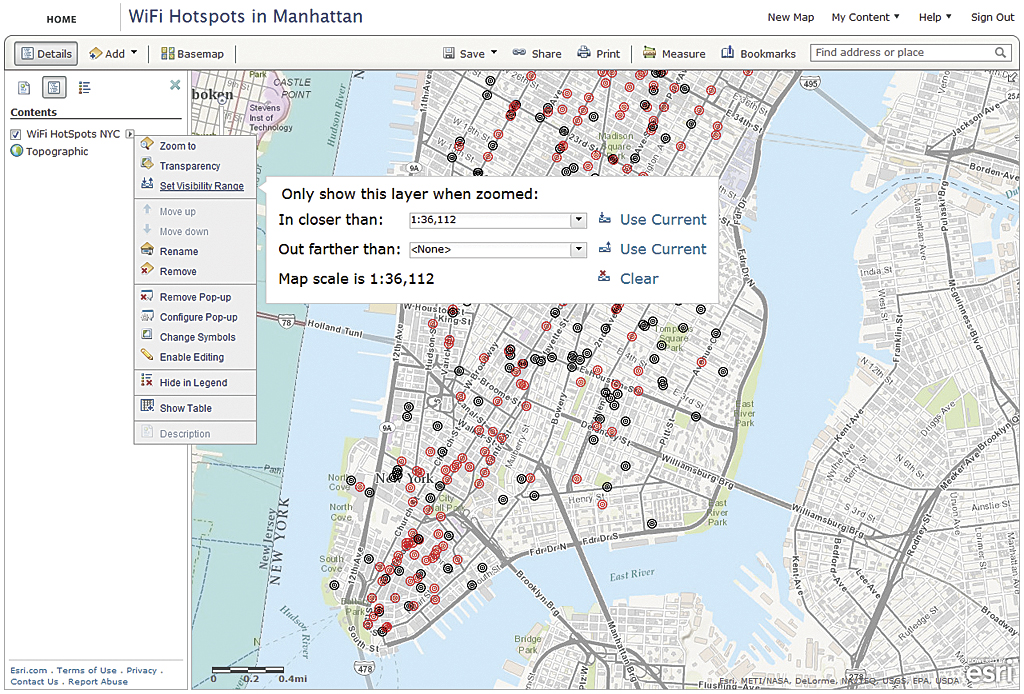
- To apply scale ranges, log in to your ArcGIS Online account. Open a map that contains the layer or layers for which you want to set scale ranges in the ArcGIS.com map viewer.
- Click the Details button, then click the Show Contents of Map button.
- Right-click on the desired layer and choose Set Visibility Range. A pop-up window appears.
- Choose the minimum scale range from the drop-down or click the Use Current button to use the current extent of the map. You can zoom the map extent in or out while the pop-up is visible.
- Choose the maximum scale range from the drop-down or click the Use Current button to use the current extent of the map.
- Click Save to save changes to the web map. Click Save Item Properties to save the scale ranges just assigned to the layer.
Filtered Views of Feature Layers
To be effective, a map should present just the data needed to convey the map’s message. New functionality in the ArcGIS.com map viewer lets you create filters for presenting just the data you are interested in showing the user of your map. Filters are like definition queries in ArcMap. You can also let people using your map interact with the filter by creating a map application using the interactive filter template.
You can create more than one filter for a layer. You can create filters with multiple expressions. For example, a filter for school data might specify that Type is Elementary and enrollment is greater than or equal to 400. If you are using more than one expression, specify that matches to all or any of the expressions will be displayed. All means all criteria must be true for features to be displayed. Any means that only one expression must be true for features to be displayed.
You can create filters on hosted feature service layers, ArcGIS for Server feature service layers, and ArcGIS for Server map service layers that have associated attribute data. In each case, you will create expressions based on the attributes in the feature layer so that only features that meet that criteria will be visible in the map.
Creating a New Filter
- Open the web map with the feature layer to be filtered in the ArcGIS.com map viewer.
- Click the Details button, then click the Show Contents of Map button.
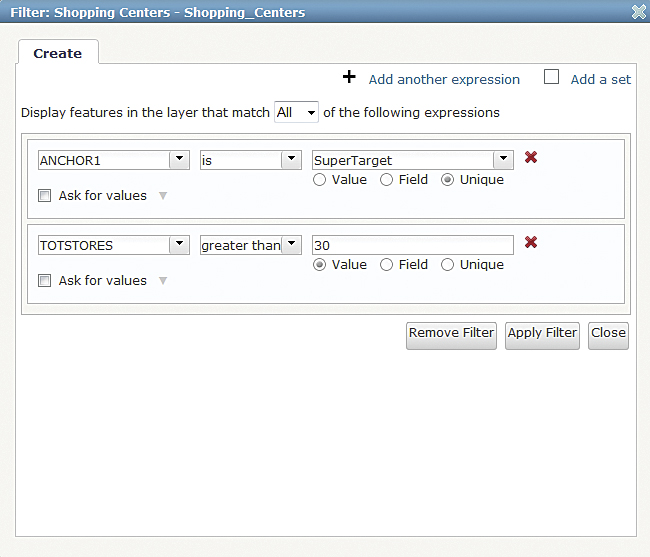
- Right-click the arrow to the right of the layer name and choose Filter. The Filter window opens containing the Create tab. On the Create tab, build the filter using the general format <Field_name> <Operator> <Value, Field, or Unique>.
- Click the Field drop-down arrow and choose the field to query against from the list. For the operator, click the Operators drop-down arrow and choose an operator from the list.
- To filter based on a specific value, choose Value in the Filter window and enter a value in the field. The input box varies depending on the field type of the field name chosen.
- To compare the value in one field versus the value in another field, choose Field, click the drop-down arrow, and choose the field for the expression.
- To filter based on a specific value in the field selected for the expression, choose Unique and select that unique value from the values that populate the field.
- You can set up an interactive expression based on values or a unique value, but you cannot ask for values on expressions based on a field. To set up an interactive expression, click the box to the left of Ask for values and enter information about the value in the Prompt field and a hint in the Hint field.
- Click Apply Filter to enable the filtered view on the map. Use the Delete button to the right of the expression to delete an expression in the filter. To show all the features in the layer again, click Remove Filter.
Some Tips When Working with Filters
- Do not add special characters (such as quotation marks) to your expressions unless those special characters are part of the value. For example, the expression <City is “New York”> will not select a feature named New York. In this example, use the expression <City is New York> instead.
- If the field you are filtering on includes coded values, the Values list shows all coded values defined by the service for the field. Because the layer values may be a subset of the service values, this list may include codes for features not present in the layer. However, the Unique list shows only features in the layer.
- If you have multiple expressions, your results will vary depending on if and how you have grouped expressions. For example, if you create a filter that uses the expressions Type is middle or Type is secondary (a set of expressions) and Category is private (a single expression) and stipulate all expressions must be true, the filter will select private middle schools and private secondary schools because all conditions must be true. If instead your filter uses the expression set Type is secondary and Category is private and the single expression Type is middle, the filter will select all public and private middle schools and private secondary schools.
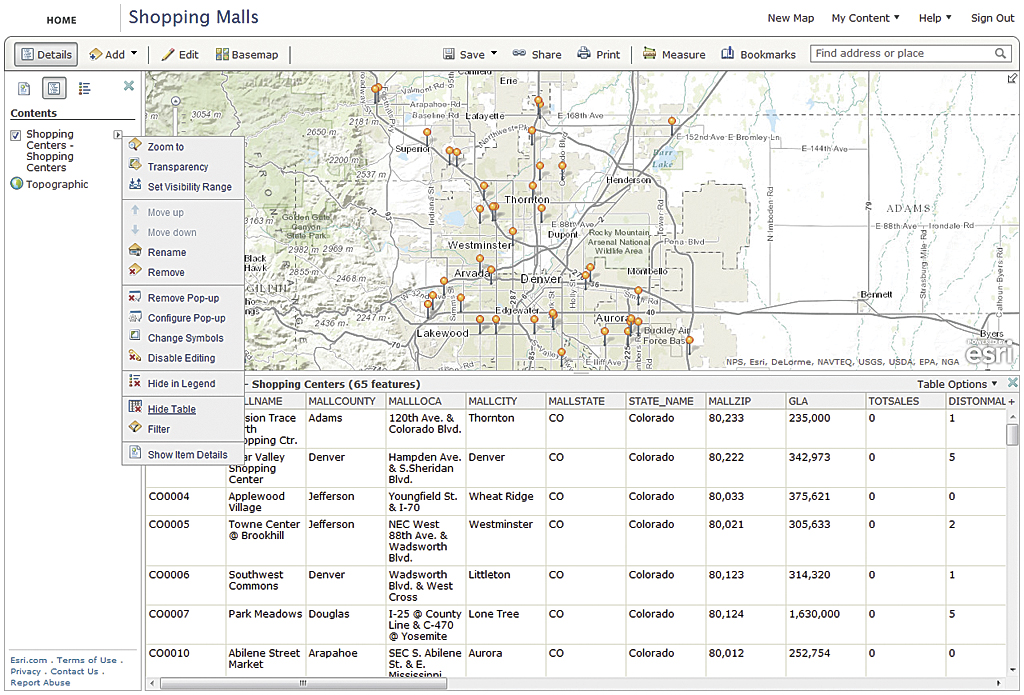
Show Attribute Tables
Tables can be a useful way to view the data in a feature layer of a map quickly. You can see the fields that you can use in filters and pop-ups. You can see tables for hosted feature services; hosted tiled map services with associated attribute data; and shapefiles, GPX files, and CSV (files and web), and ArcGIS 10 Server Service Pack 1 and later feature and map services.
To view the attribute table for a layer in a map in the ArcGIS.com map viewer, click the Details button, then click the Show Contents of Map button. Right-click on the layer and choose View Table. You can change the field order by dragging the header for that field to a new location. To see the feature for a record, select it in the table, click the Table Options drop-down arrow on the right side of the table, and choose Zoom to Selection. The Table Options drop-down also has choices to show or hide fields, filter records in the table, and clear a selection. Tables and pop-up windows share the same attribute fields and formatting. You can change a field name by editing the field alias in the Configure Attributes window of the Pop-up Properties.
Conclusion
These new tools in the ArcGIS.com map viewer will help you focus the attention of users on your message by controlling what they see and when they see it.