Mapping aids mitigation and planning in Washington State
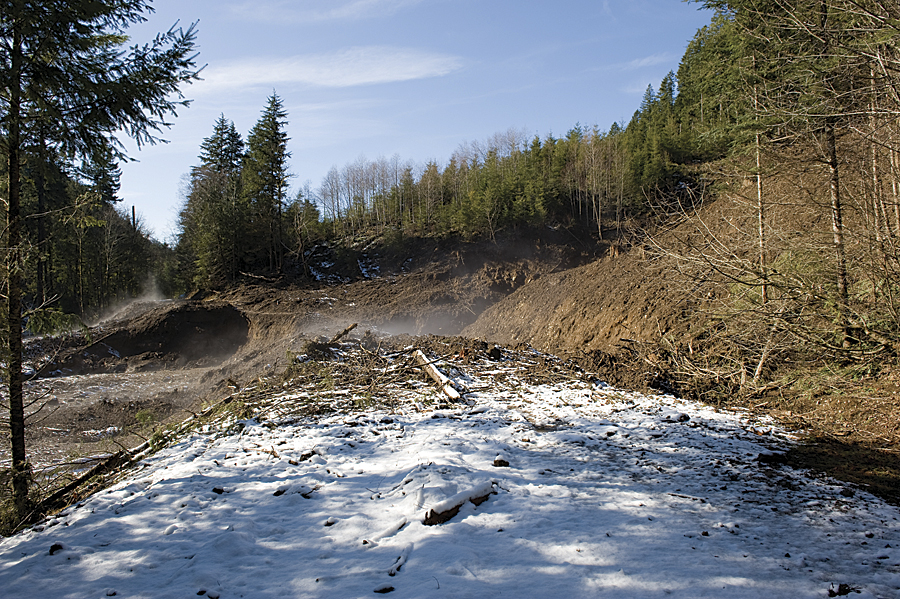
Landslides, triggered by large storm systems and earthquakes, can cause hundreds of millions of dollars of damage in Washington. Along with landslides, tsunamis caused by seismic activity and lahars resulting from volcanic eruptions can threaten the safety and property of residents in Washington state. Geologists from the Washington State Department of Natural Resources (DNR) Geology and Earth Resources Division have been identifying, assessing, and mapping these geologic hazards for years.
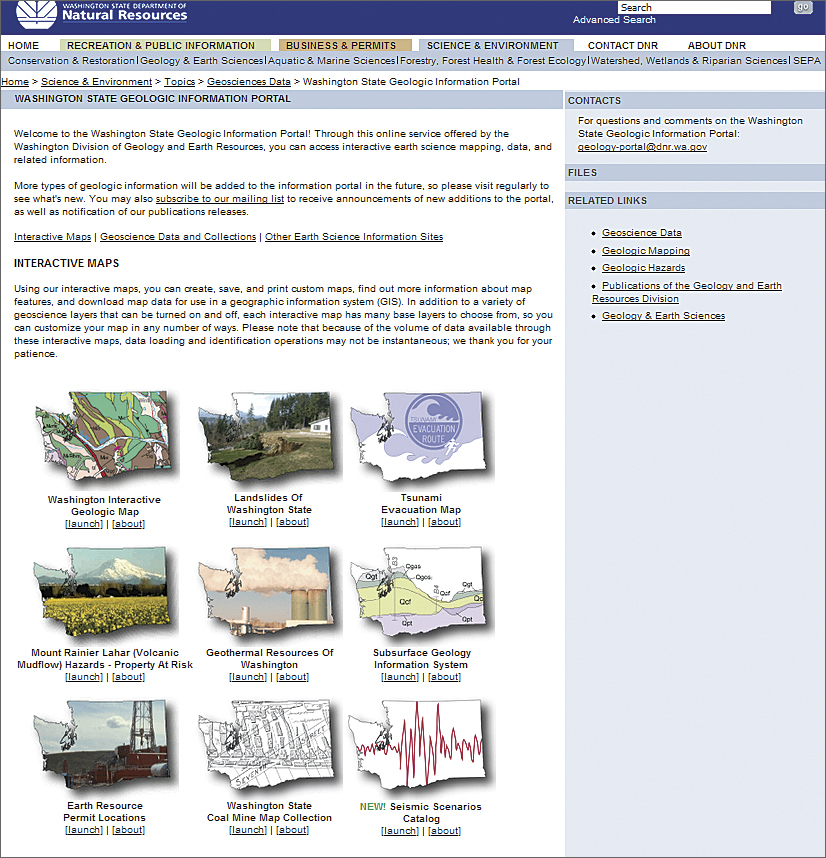
Now the Washington State Geologic Information Portal makes this vital information available through interactive GIS-based hazard maps that aid land-use and emergency management planning, disaster response, and building code amendment.
“We have a lot of GIS-based geologic data, and much of it is pretty complex,” said Karen Meyers, an editor at the Geology and Earth Resources Division at DNR and manager of the Washington State Geologic Information Portal. “We wanted to give the public accurate data so that they can see the relationship of geology to where they are and how geology affects their life without having to know how to use GIS.”
As Washington’s population has continued to grow, so has the pressure to build in hazardous areas. The 1990 Growth Management Act mandates the use of the best available science to manage the state’s growth intelligently. In 2000, the perspective on how DNR data could be used began to shift as the organization realized that maps and the spatial relationships they convey can be understood not only by specialists but also by a much wider audience. Anyone could discover patterns and relationships in digital maps and even make their own maps using a relatively simple front-end system that accessed cartographic information and processing power.

Initially the department adopted ArcIMS, Esri’s first Internet map server, to map data from the department’s databases and make it available through a website. Recently, the department migrated its interactive mapping from ArcIMS to ArcGIS for Server, which provides faster performance, and has developed a gallery of maps that make its resources readily available.
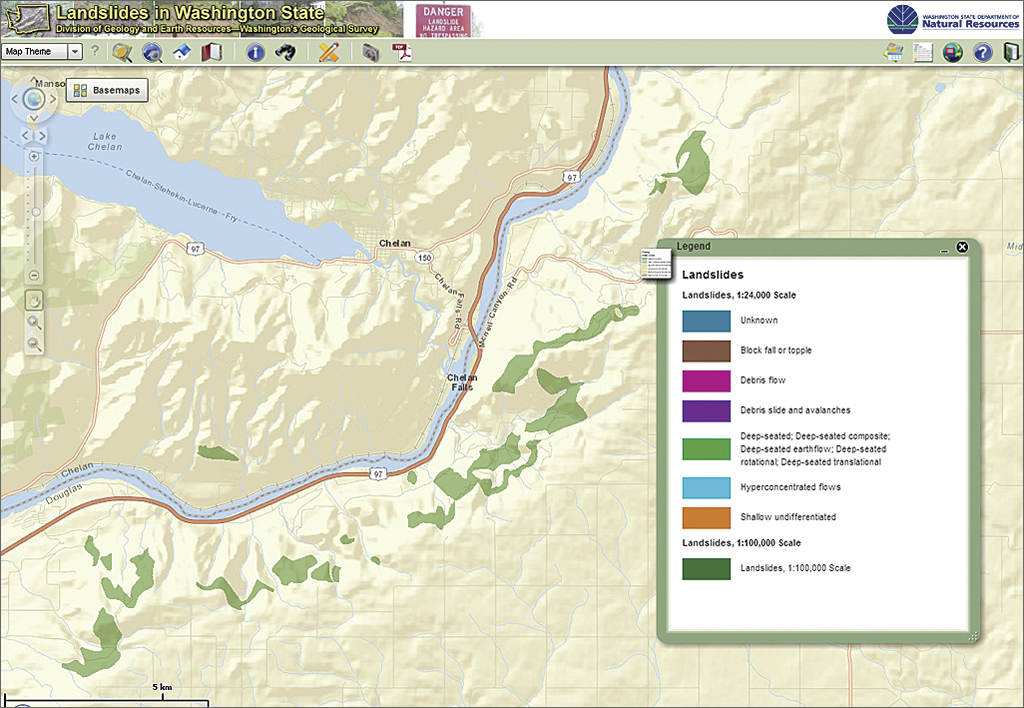
The Landslides in Washington State map exemplifies how these maps make DNR’s work benefit a larger audience. Using ArcGIS for Server, DNR connected its basemap services to information from its landslide database so that anyone can see the landslide history and potential in any given area. “The landslide maps show which areas have been prone to collapse in the past so that local jurisdictions can draft their mitigation plans,” said Meyers. “If they know a storm is coming, they can use these maps to focus their attention on areas known to be landslide prone.” That helps DNR issue more granular landslide alerts and be better prepared to deal with the problems when they occur.
Danger to Land from the Sea
Although less common than landslides, tsunamis pose a real risk to coastal communities in Washington, which is located next to the giant Cascadia subduction zone, a fault of more than 600 miles that stretches along the Pacific coast from Northern Vancouver Island to Cape Mendocino. An earthquake in this region could generate a tsunami that would strike Washington with great force in a short time.
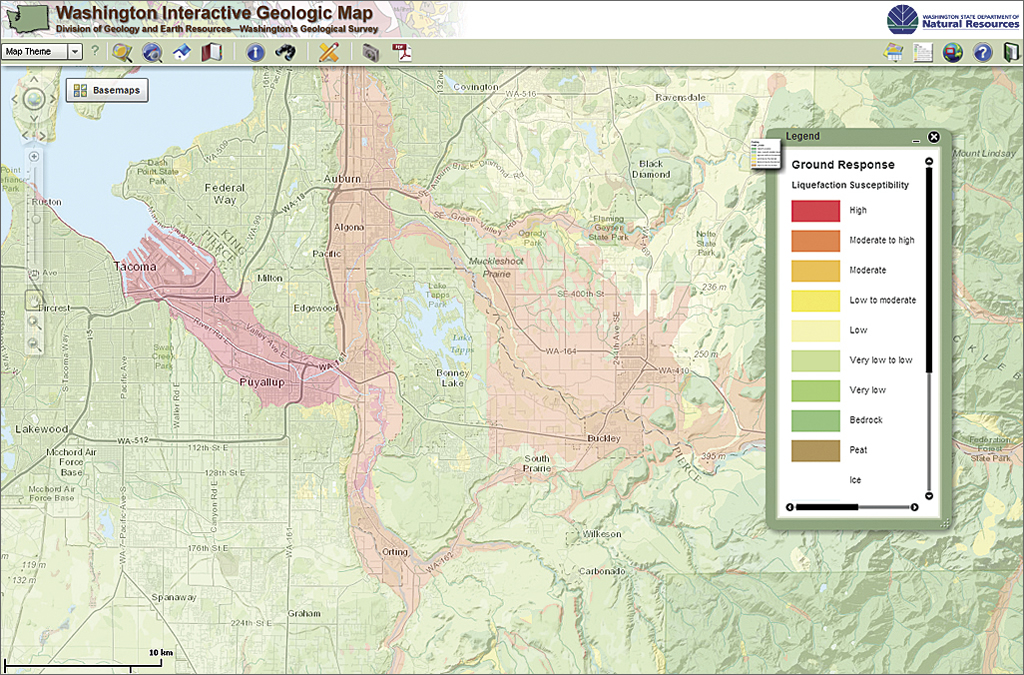
DNR combines land-use and land-cover datasets with inundation mapping to assess what areas would receive the greatest impact from a tsunami. “We calculate wave height, velocities, and amplitudes from topography and bathymetry and then feed it into ArcGIS for Server to show the extent of inundation on a map,” said Tim Walsh, geohazards geologist at DNR. “That helps us better understand how these populations and structures will be affected.” A layer showing inundation is part of the Washington Interactive Geologic Map.
This map also contains layers showing liquefaction. Walsh and his team used data from DNR’s liquefaction susceptibility index, an engineering proxy to test load-bearing capacity for buildings, to create the map. “Taking into account earthquake-induced liquefaction potential in tsunami inundation zones makes it more than just pushpins on a map,” said Walsh. “Incorporating information about soil helps jurisdictions create safer and more efficient evacuation routes that take into account the collateral damage from an earthquake.”
Walsh and his team include data from landslide hazard maps when creating the evacuation maps and brochures, since extreme shaking would loosen soil in landslide-prone areas. This helps emergency response know the stable areas to send personnel to in such an event. Walsh and his team also created separate tsunami evacuation zone maps in ArcGIS that were output as PDFs to make them available on-site.
Volcanic Neighbor
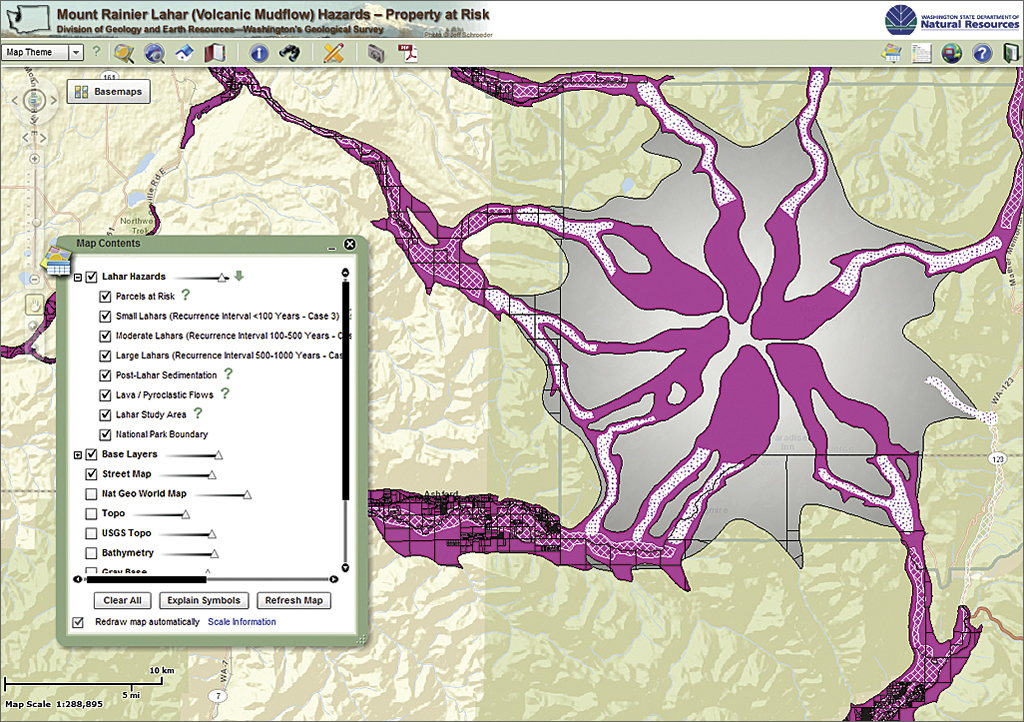
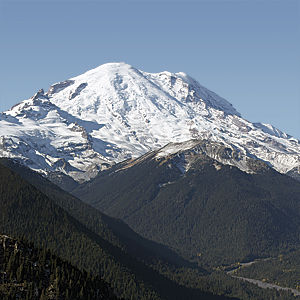
Washington’s Mount Rainier has the potential for a major eruption. If such an explosion occurred, it could melt the mountain’s picturesque snow cover and create huge mudflows called lahars. Historically, major lahars have occurred every 500 to 1,000 years, caused not only by volcanic eruptions but also as a result of avalanches and earthquake. DNR has estimated that an eruption of Mount Rainier could produce property losses of as much as $6 billion to communities in the Puyallup Valley.
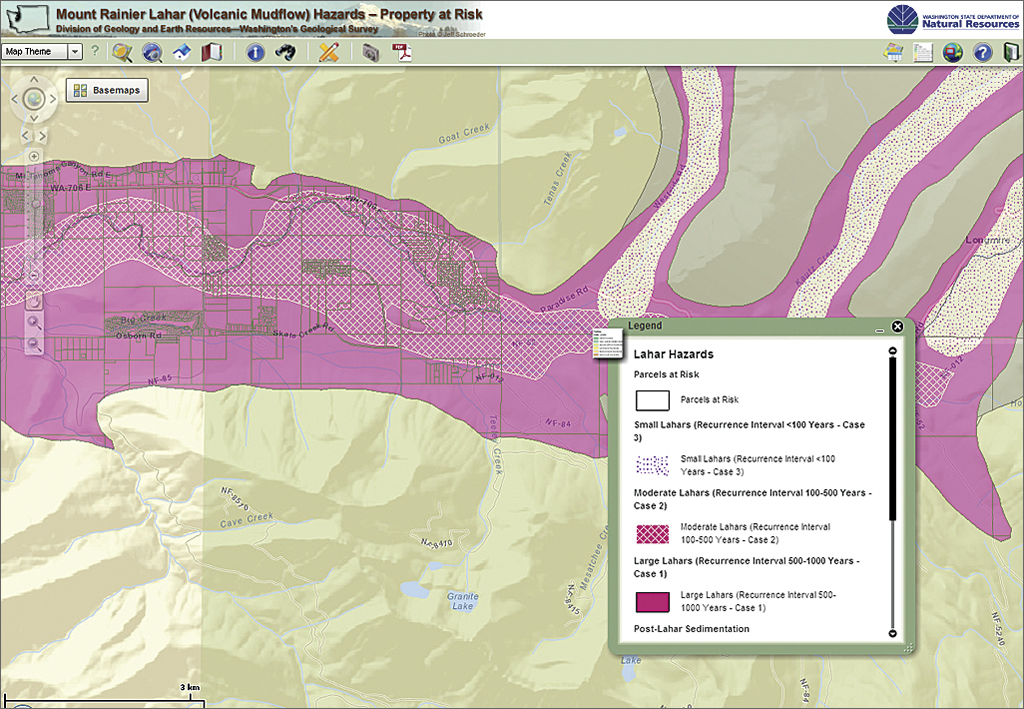
Over the years, the US Geological Survey has collected and compiled data on hazard zones for one of North America’s most dangerous volcanoes. DNR has used that data showing the predicted path and extent of such flows and a parcel layer providing the value of land and structures. This map not only aids in mitigation planning and emergency response for surrounding communities but also helps estimate losses from lahars.