“Geodesign is both an ancient idea and a new idea supported by new and advancing technology,” said Esri president Jack Dangermond as he welcomed more than 300 people from around the world to the 2015 Geodesign Summit in Redlands, California. “I see GIS integrating into almost anything we do.”
Geodesign combines the art of design with the science of geospatial technologies—such as GIS—to find smart and sustainable design solutions. Most often these solutions have focused on landscape architecture, urban planning, and environmental conservation, but the geodesign tent is getting bigger. Geodesign is also being increasingly embraced, albeit on a smaller scale, as an approach to economic development, urban transportation, and even gaming. And geodesign is increasingly being done in 3D.
The summit, which was held January 22–23, is in its sixth year. It was obvious from the breadth of topics covered in the presentations and Lightning Talks that modern geodesign concepts, practices, technologies, and education are maturing quickly. Geodesign in 3D also had a big wow factor.
Keynote speaker Noel Cressie, distinguished professor at the University of Wollongong in Australia, also added spatiotemporal statistics and the importance of conditional probabilities to the geodesign equation.
Game for Geodesign?
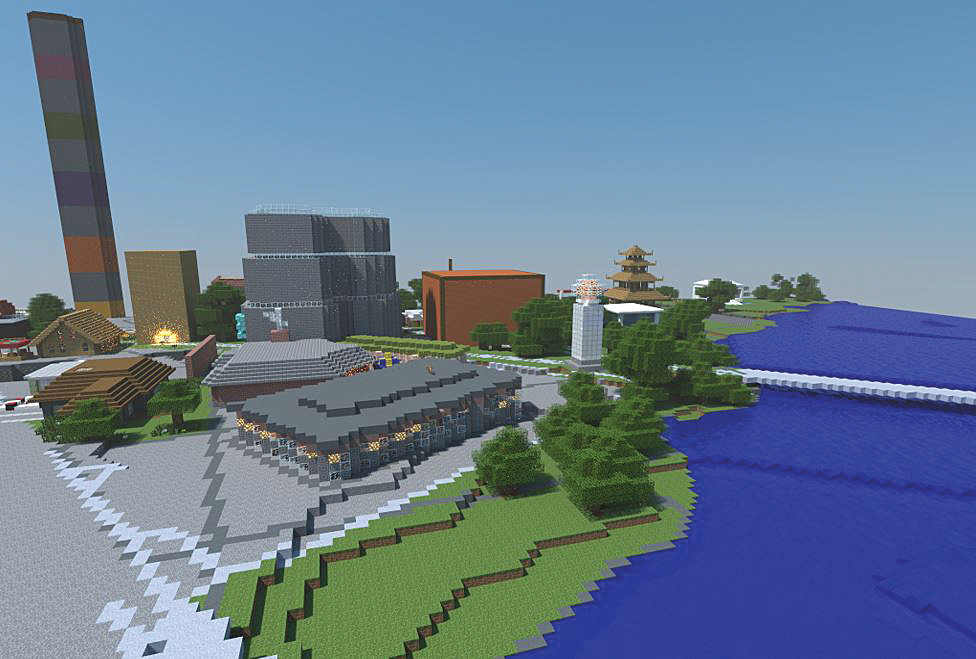
Gamers (and the parents of gamers) in the audience were intrigued by Ulf Månsson’s presentation that showed how geodesign was integrated into the popular video game Minecraft.
Månsson, a senior project manager for the Swedish sustainable engineering and design firm Sweco, was a gamer as a youth. His son and his friends now build things together in Minecraft. They create 3D virtual worlds. Inspired by seeing his son doing what was essentially the same design work he does at the office, Månsson created a method to stream geospatial data into the Minecraft server.
Assisted by his Sweco colleagues, Månsson used GIS tools to build the land data that would form part of the foundation for Blockholm, a replica of Stockholm, Sweden, that would be added to Minecraft. They used Esri’s ArcGIS Data Interoperability, an extension for ArcGIS for Desktop, to process real spatial data, such as topography, waterways, roads, and property information, and generate it in 3D.
Blockholm, a project conceived by the Swedish Centre for Architecture and Design, essentially married geo and design in a virtual world. More than 10,000 Minecraft players later used its roadways, water features, and property information as a foundation to rebuild Stockholm as they envisioned it.
Because the ArcGIS Data Interoperability extension now natively supports Minecraft formats, the data can also be read back. “So if you set up a project like this where you invite players to rebuild a world, you can compare (worlds) before and after and just take out the pieces that have changed and bring them back to a GIS system such as [Esri] CityEngine,” Månsson said. “You could go from a CityEngine model to Minecraft, have it edited there, and then bring those edits back to CityEngine.”
Geodesign of Land-Use Patterns
Joseph Minicozzi, architect, urban designer, and principal of the econometric consulting firm Urban3 in Ashville, North Carolina, gave a featured presentation. He uses geodesign to show officials and citizens how downtown areas in cities can be economically vital and viable as compared to strip malls.
“What is a city? For me, a city is a finite boundary of land that has to be managed,” said Minicozzi. “It is essentially a farm that grows a crop of buildings. There is a cash flow behind all of that. My task here is to explain that cash flow.”
In ArcScene, an application that is part of the ArcGIS 3D Analyst extension, Minicozzi’s maps showed the taxable value per acre of land as elevations. He showed a map of Travis County, Texas. The highest extrusion was located in downtown Austin, the county seat. Another map showed a high spike for alcohol sales in downtown versus the mall areas in the suburbs.
He mapped other tax data for Travis County, including mixed beverage and food sales per acre. “You see downtown popping off the map,” Minicozzi said. The maps starkly illustrate how buildings downtown can often generate much more property tax and city retail tax revenue than suburban strip malls.
Minicozzi recalled hearing Dangermond once say, “If you put it on a map, people get it quickly.” That made an impression. “We’ve seen this time and time again; when we make these three-dimensional models of the taxes, people get it,” said Minicozzi.
Geodesign Technologies Demonstrated
Esri has worked hard to develop new and nimble geodesign tools including GeoPlanner for ArcGIS, the ArcGIS Pro application in ArcGIS for Desktop, and Esri CityEngine. Esri’s Rob Matthews used the tools in GeoPlanner for ArcGIS to create a hypothetical Bus Rapid Transit (BRT) route through downtown San Diego, California, leveraging a geodesign approach. He used the app’s tools to study planning issues at multiple scales, from a city-wide BRT routing to the fine-grained placement of stations and the evaluation of land-use regulations to support Transit Oriented Development (TOD) at the site scale.
He also demonstrated the app’s capability to do live analysis in the cloud, such as walk times from proposed BRT stations, design schemes with enriched curated demographic data, and suitability for BRT station placement using a weighted raster overlay service. He demonstrated how the app can be used to compare project alternatives using a dashboard for key performance indicators. Finally, he prepared a higher density development option to export to ArcGIS Pro for further refinement in 3D.
Esri’s Nathan Shephard used ArcGIS Pro to take this downtown San Diego design to a larger scale. Existing 3D buildings (courtesy of Pictometry) provided context around potential building development sites. A proposed building outline was digitized in 2D using precision editing tools. A synchronized 3D view rendered the simple shape as a constructed 3D building—complete with realistic texturing.
A simple spatial query identified which buildings would impact existing underground water mains. The results of previously run solar and wind analyses revealed areas of the design that would create heat islands. Rather than use ArcGIS Pro interactively to place individual trees to reduce the heat, Shephard said the problem was better attacked parametrically as part of the street design process.
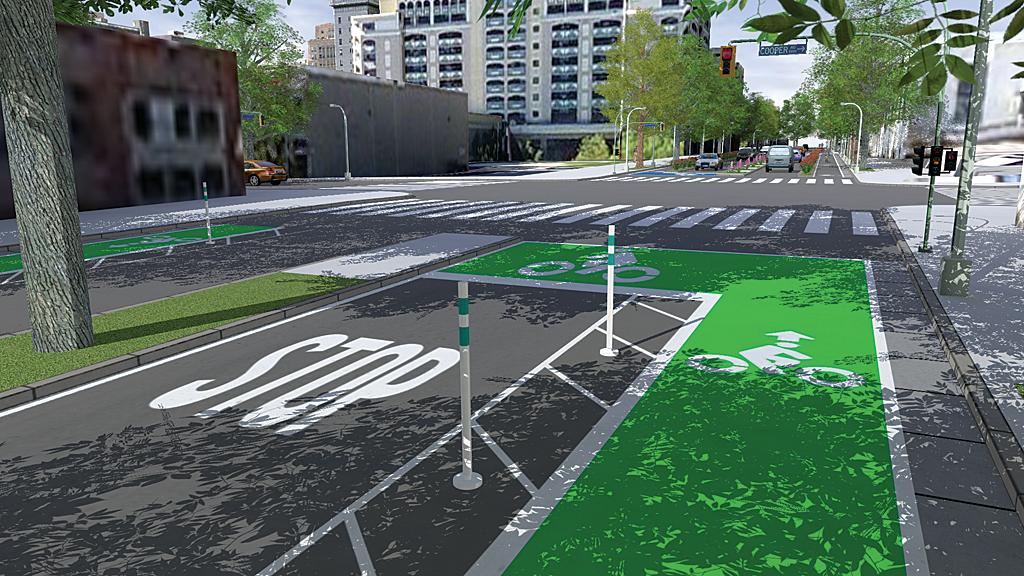
Shephard then turned the demo over to his colleague Brooks Patrick, who demonstrated the 3D capabilities in Esri CityEngine. CityEngine supports rapid design iterations, giving users the tools and rules to create a city, neighborhood, or even a street.
Using data from Shephard’s downtown San Diego demonstration, Patrick showed the audience Complete Streets, a procedural street sample that incorporates knowledge and ideas from transportation planning guidelines and standards, to generate a default street, then added 2.5-meter-wide bike lanes with 1.2 meter buffers for each lane and planters, curbs, and trees. Not only can Complete Streets be used to visualize the bike lanes, curbs, and trees in 3D, it can also generate analytical reports on various aspects of the street’s geometry that are useful in coming up with rough cost estimates for construction work.
“Planning our environment carefully—leveraging GIS, 3D, and the best possible design practices—will be critical for building a sustainable future,” said Esri’s Eric Wittner.
Make plans early for the next Geodesign Summit, which will be held January 27–28, 2016. Check in regularly at geodesignsummit.com or contact geodesignsummit@esri.com. And be sure to follow happenings on Twitter at @geodesignsummit.