One of Australia’s largest water providers used the advanced location-based analytics in ArcGIS to conduct a meter audit far more efficiently and quickly than previous methods it used.
Power and Water Corporation is responsible for electricity transmission and distribution and provides water and sewer services across Australia’s Northern Territory, an area of more than 1.3 million square kilometers (or 521,000 square miles). With the company’s bottom line affected by a network of aging water meters, the utility embarked on a water meter replacement program. The company used an advanced location-based analytics solution and improved the efficiency of processes, particularly in the capture and communication of information.
Each day Power and Water Corporation’s aging network of meters remained untouched, revenue leaked from the company. Some meters had completely failed and recorded none of the water used. Other meters inaccurately measured usage. In one case, an older meter had been recording usage of $10 per day. When it was replaced, the new meter recorded usage of $85 per day. The company needed to check and—when necessary—replace meters for all its commercial clients.
The previous data collection workflow was inefficient and time-consuming. Contractors visited each meter, assessed its condition, replaced the meter if required, and manually entered all the data they collected on printed spreadsheets. These documents were carried back to a central office, where the data was typed into a central database so it could be used by the project manager to coordinate the rollout and identify any data gaps.
This workflow caused data to be handled multiple times, required return visits that delayed data collection and entry, and sometimes resulted in lost and mismatching data to assets. This significantly delayed meter replacement and increased costs.
Power and Water Corporation needed to reinvent its data collection processes and wanted to try a GIS technology solution so it could build a business case for a full-scale location-based analytics implementation.
The company chose a commercial off-the-shelf (COTS) solution that leverages Esri’s ArcGIS platform. This solution sped up every stage of the project. It provided fast routing to each meter and enabled work in the field to be reviewed remotely as soon as it was completed.
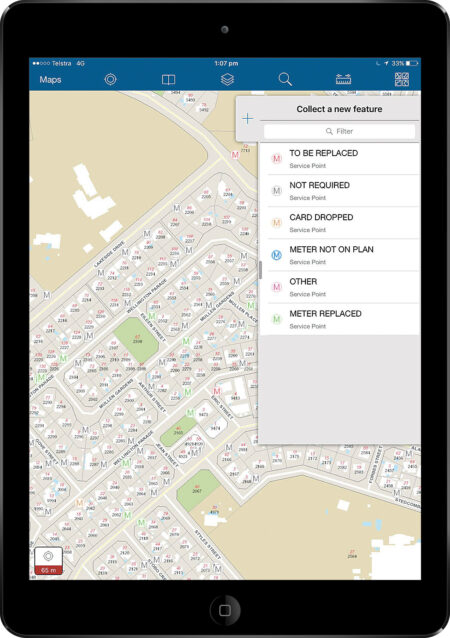
The solution was deployed on Apple iPads so staff and contractors could efficiently collect and update information in the field. Before the solution was taken into the field, the system was populated with records for the meters so that a meter’s location and other details could be verified on-site and corrected immediately if needed.
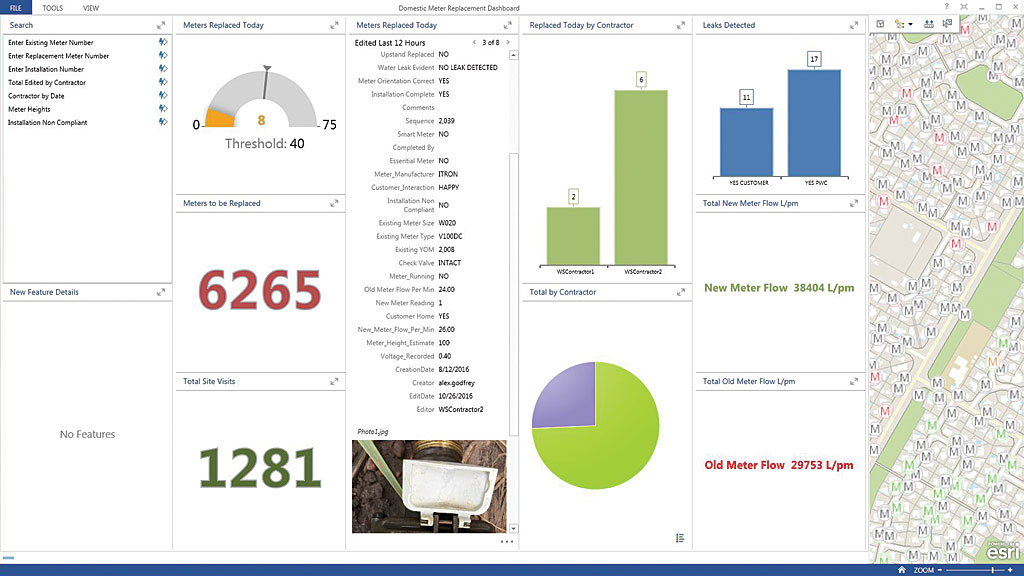
Once an inspection was completed, the data was uploaded to the operations center so teams in the office could work with it immediately. The project manager, who monitored the project’s ongoing status via a map-based dashboard, could identify any issues and act on them immediately. In addition, data on meters can now be instantly accessed, enabling many issues to be resolved from the office rather than sending a contractor to the site.
This solution improved data reliability and accuracy, furnished data in near real time, and reduced the duplication of efforts. This enabled the project to be completed much more quickly than expected.
In some cases, it had taken three months to log data, but now the same process was reduced to minutes. While it was initially projected that 20 to 30 meters would be replaced each day, in practice the number of meters replaced daily averaged between 40 and 50.
“This has sped the entire project up by 60 to 70 percent, which pleases management and our customers,” said Power and Water GIS officer Alex Godfrey.
The solution took just two weeks to deploy.
The project also improved Power and Water’s data integrity. As a single-point-of-truth, the solution provided a streamlined data collection process that removed the risk of misallocated, lost, or duplicated data.
The system’s user-friendly interface allowed the project manager and staff to make confident and timely decisions about the rollout, instantly visualize data gaps, and rapidly access and analyze information pertaining to physical infrastructure and environmental assets by simply clicking on a map.
With the success of the trial project, the technology will be expanded and used in a new—and much larger—project. Based on the results and the return on investment generated, the executive management team has approved the expansion of location-based analytics to the existing Retail Management System. It is also being considered for use in the strategic analysis of expansion and asset management plans in the future.
Download a full case study on Power and Water Corporation’s industry-leading solution.