Supporting and Incorporating Science
Esri’s technology has always been grounded in science.
Dawn Wright, Esri chief scientist, summarized the company’s many-faceted relationship with science. “Science at Esri continues to evolve on many exciting fronts as we focus on supporting both basic and applied science while also recognizing that there are many major themes of compelling interest to society that will drive scientific research for the next several decades.” She noted that Esri views science not only as a way to understand how the Earth works but also to understand how the Earth should look through the application of geodesign principles and to understand how we should look at the Earth through the lens of datasets that are developed, documented, analyzed, and modeled.
Esri has a long history of creating geospatial tools that are particularly helpful to scientists who are expanding fundamental understanding in many fields of scientific study. Ocean science, conservation biology, ecology, sustainability, climate science, forestry, agriculture science, geology and geophysics, hydrology, and geographic information science are areas of scientific inquiry that Esri has extensively supported through the development of specific tools. Beyond enhancing basic scientific research, Esri’s GIS tools promote fact-based decision-making and enable effective stewardship of natural resources, protection of life and property, and promotion of economic vitality.
An ever-expanding arsenal of spatial analysis tools available in ArcGIS Pro and ArcMap assist scientific inquiry such as space-time pattern analysis and mining using the Space-Time Cube tool, raster segmentation and processing, additional 3D functionality and visualization of lidar datasets, and pairwise feature processing. ArcGIS is a comprehensive platform for using imagery. Robust management and processing tools improve the accessibility and usability of data sources.
Access to high-quality, accurate, and current data is essential to scientific work. In addition to supplying a comprehensive platform for creating, managing, integrating, modeling, and sharing users’ data, Esri has been continually expanding the data it furnishes to users from the Digital Chart of the World (DCW), created in 1992, to today’s Living Atlas of the World.
Esri has always sought to provide access to authoritative maps and datasets on a global scale. The basemaps it provides through ArcGIS Online eliminate the nontrivial task of generating foundational datasets for mapping operational layers of interest to scientists. The Living Atlas of the World, available through ArcGIS Online, provides easy access to the largest, highest-quality collection of ready-to-use geographic information that has ever been assembled. This collection is available from any device, anywhere, at any time and is constantly growing and changing as maps, apps, services, and layers are added or updated by Esri and the ArcGIS user community.
The World Imagery map, which receives several billion map requests each month, is the most popular basemap provided by Esri on the Living Atlas. Available online as a tile service hosted by Esri and on-premises through the Data Appliance for ArcGIS, it provides a natural-color, multiscale image map of the world built from the best available sources. The World Imagery map can be used for many applications including visualization, data collection, and offline mapping.
As part of Esri’s constant efforts to improve the scope, currency, and usefulness of the data in the Living Atlas of the World, a new multiyear partnership with DigitalGlobe was announced at the 2016 Esri User Conference. DigitalGlobe provides high-resolution imagery to update large parts of the World Imagery basemap. Through this partnership, Esri has access to DigitalGlobe’s flagship basemap products to provide submeter resolution imagery for the United States, western Europe, Australia, and several hundred large metropolitan areas and 1-meter imagery for other parts of the world and will update this imagery periodically to improve the image quality and currency. During the first year of this partnership, Esri and DigitalGlobe will update approximately 90 million square kilometers of imagery in the World Imagery map.
Standards and Open Source
ArcGIS tools support standard scientific processes and integrate well with other platforms and programs thanks to Esri’s longstanding support of standards and interoperability. ISO TC 211, Open Geospatial Consortium (OGC), and more than 100 other geospatial standards are supported by the ArcGIS platform, resulting in direct read, import, and export capabilities for more than 300 data and service formats. The ArcGIS Runtime SDKs and APIs that let developers build and deploy native applications to popular platforms and devices are all open.
ArcGIS integrates with two of the most popular scientific software packages: R and Python. The R–ArcGIS Bridge lets developers create custom tools and toolboxes that integrate ArcGIS and R and let ArcGIS users incorporate R into their workflows without having to learn the R programming language. As a member of the R Consortium, Esri will continue to work with the R community to increase analysis capabilities across multiple disciplines.
Python, the scripting language for ArcGIS, has been part of the ArcGIS platform ecosystem since ArcGIS 9.0. The strong and diverse Python community includes many scientists who may not consider themselves programmers but who use Python—like GIS—to get their work done.
In 2014, ArcGIS was integrated with the SciPy stack, a collection of modules that perform functions useful to the scientific and engineering communities and are also the basis for other packages focused on applications such as deep learning and Bayesian statistics. The use of Python with ArcGIS has expanded with the integration of the Python Spatial Analysis Library (PySAL) and the introduction of the ArcGIS API for Python.
A powerful, modern, and easy-to-use Python library for performing GIS visualization, analysis, and spatial data management, the ArcGIS API for Python provides access to big data tools programmatically and popular and powerful Python packages for data analysis. The Python netCDF4 library has been added so netCDF, the most popular scientific community format for multidimensional data, can be directly used. It also can automate GIS system data management and administration tasks interactively or through scripts.
Esri participates in open-source development though incorporating and contributing to more than 200 open-source projects and hosting more than 350 Esri open-source projects on GitHub. Through GitHub, a social network for programming, Esri promotes development and collaboration in the creation of open source software. The Esri repository contains hundreds of projects as well as resources for troubleshooting and concept samples.
Communicating Science
For the most part, policy makers and the public are not trained in science but can greatly impact the funding of science and the application of scientific findings to policy decisions. GIS is not only a valuable tool in conducting scientific studies but can also be invaluable in communicating science.
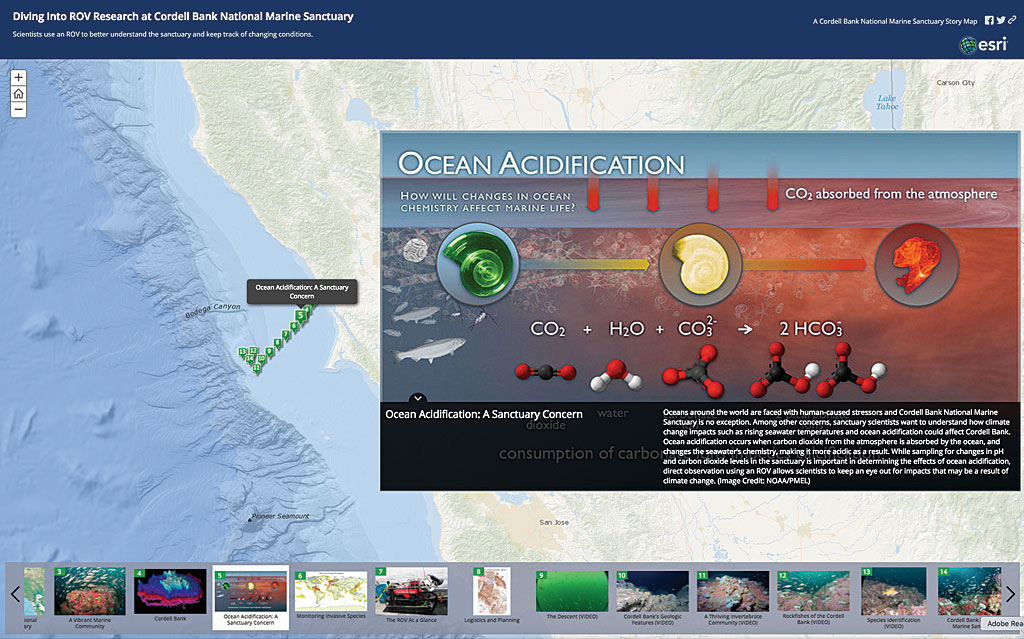
Esri Story Maps apps were developed as information products for making complex concepts and data comprehensible. Scientific organizations are finding story maps to be exceptionally effective tools for communicating the value of their research activities.
The National Oceanic and Atmospheric Administration (NOAA) website hosts a gallery of story maps that explain topics from the scope of its current hydrographic surveys to the impact of the ocean and Great Lakes economies.
The United States Geological Survey (USGS) uses story maps to transform its reports into interactive information products that bring the science—and the stories behind the science—alive through maps, photos, videos, graphs, and charts. These story maps communicate benefits of the varied and vital work done by USGS.
Story maps are also being widely used by educators to teach lessons that promote science, technology, engineering, and math (STEM) education. The University Corporation for Atmospheric Research (UCAR) Center for Science Education uses Esri Story Maps apps as part of its science education curriculum for K–12 students, education technology, undergraduate education efforts, and school and public programs.
Doing Science with Esri
Beyond its work in developing the platform, tools, and data to support scientific work, Esri itself has sought to do good science because science underpins the company’s work. To this end, Esri works with scientists from many academic, government, and nongovernmental organizations. Recently it has closely collaborated on two global projects that provided a research framework for land and ocean.
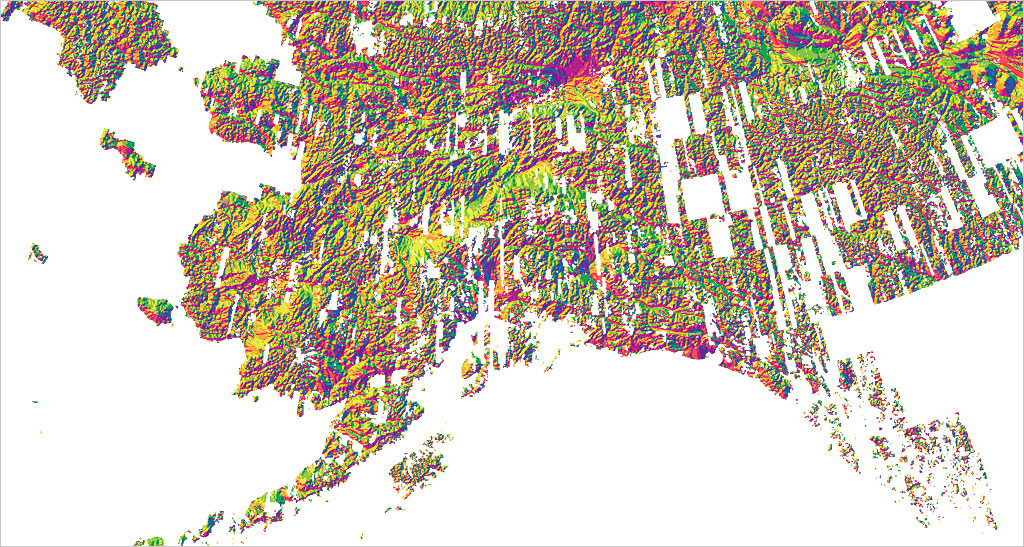
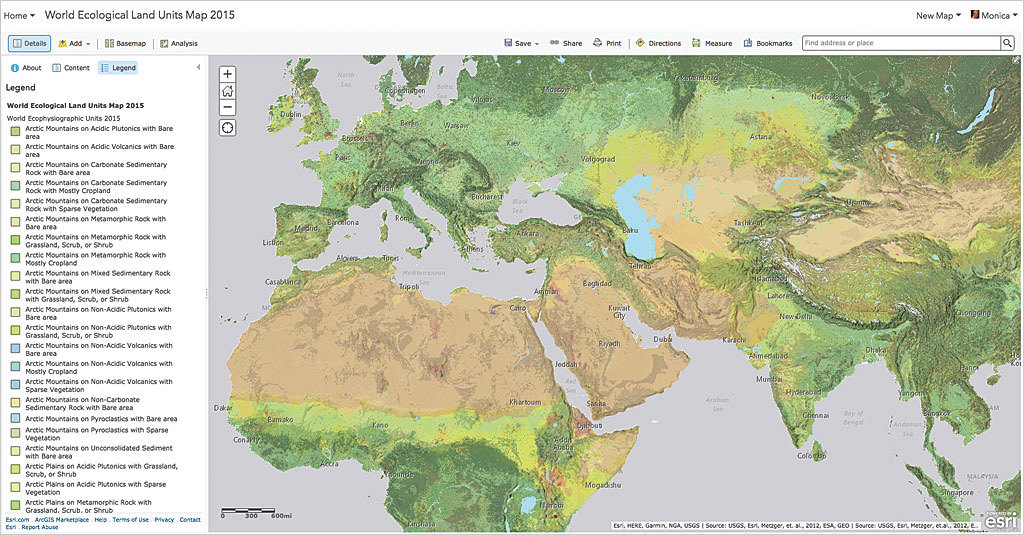
Esri and USGS worked together to develop the Global Ecological Land Units (ELUs) map, the highest spatial resolution portrayal of the systematic division and classification of ecological and physiographic information about land surface features. Released in 2014, layers from this map are freely available from ArcGIS Online.
The global map of Ecological Marine Units (EMUs), released in September 2016, was commissioned by the Group on Earth Observations (GEO) and created through an innovative public-private partnership. That partnership was led by Esri and the USGS in collaboration with NatureServe, the Marine Conservation Institute, the University of Auckland [New Zealand], GRID-Arendal [Norway], Duke University, the Woods Hole Oceanographic Institution, the National Institute of Water and Atmospheric Research (NIWA) [New Zealand], NOAA, and the United States National Aeronautics and Space Administration (NASA). (See “The First Global, Data-Driven, and Truly 3D Ocean Map” in the winter 2017 issue of ArcUser.)
Esri is currently involved in many other projects; here are just a few of them.
Esri’s statistical design teams will be consulting with Distinguished Professor Noel Cressie and his research group at the Centre for Environmental Informatics, University of Wollongong, Australia, on a range of development projects in areas including geostatistics, space-time pattern mining, R statistical software integration, and statistical clustering algorithms to optimize Esri ecophysiographic, ecological marine, and world population layers.
In its collaboration with 52 North, Esri has worked on projects to facilitate the interoperable processing of sensor data and improving spatial data infrastructures. (Read about this work in “Sharing Geoprocessing Tools Via the Web” in the Fall 2016 issue of ArcUser.)
Working with the NCAR’s GIS Program, Esri is helping develop web services to add climate data in netCDF format to the Living Atlas of the World to support the NCAR Community Earth System Model (CESM). NCAR is also working with Esri on LearnGIS modules.
Organizational Representation
As members of numerous scientific boards and councils, Esri staff members are working on committees to accomplish short- and long-term strategies for the research, education, and application of science related to government, academic research, data stewardship, and technology standards.
This is just a sampling of the organizations that have Esri representatives: NOAA Science Advisory Board, the Department of Commerce Data Advisory Council (CDAC), US Census Bureau Census Scientific Advisory Committee (CSAC), the National Geospatial Advisory Committee (NGAC), the Vespucci Initiative for the Advancement of Geographic Information in Science, the Federation of Earth Science Information Partners (ESIP), committees and the board of directors of OGC, the Scientific and Technical Advisory Board of 52 North, Liaison Team service plus advisory roles on three funded projects of the National Science Foundation (NSF) including the EarthCube Initiative, the International Cartographic Association, the Consortium for Ocean Leadership, the Science Advisory Council of the Conservation International, and the National Science Teachers Association.
Esri staff members publish their scientific research in scholarly journals. The Esri_Pubs group on zotero.org is a repository of peer-reviewed publications and related materials by Esri staff members. Some Esri staff also hold editorial positions. Kenneth Field is the editor in chief of The Cartographic Journal, and Dawn Wright is an associate editor for Marine Geodesy.
Supporting STEM Education
The ConnectED initiative, launched in 2013 by then-US president Barack Obama to make American schools more technologically savvy, has been supported by Esri from the beginning. Esri founder and president Jack Dangermond offered ArcGIS Online to every public, private, and home school in the United States for free. Since then, approximately 4,000 schools have activated ArcGIS Online accounts and downloaded hundreds of thousands of the GeoInquiries lessons produced by Esri.
In 2016—after investing more than $40 million—Dangermond pledged continued participation in ConnectED through 2019, offered ArcGIS Online for free to 300 primary and secondary schools and vocational institutions in 10 European Union member states, and launched ConnectED programs for schools in Australia and New Zealand. Esri supports the American Association of Geographers’ efforts to recruit GeoMentors and pair them with schools and teachers around the country. Along with corporate support for STEM education, Esri products, such as Collector for ArcGIS and Survey123 for ArcGIS, enable citizen science projects.
Connected with the Scientific Community
The Esri User Conference (Esri UC) has always been a venue for scientists to share the work they do with GIS. For the second year, the Esri UC will host the Science Symposium, a gathering designed to improve ties between Esri and the scientific community. Esri also hosts other events of special interest to scientists: Geodesign Summits in Redlands, California, and Europe; the Health and Human Services GIS Conference; the Ocean GIS Forum; and the Esri Developer Summit.
In addition to annual events, scientists can connect online to get the most current information about the GIS science community and GIS technologies of special interest. The Science Group on GeoNet hosts discussions related to scientific work, provides direct interaction with Esri staff, and answers to how-to questions.
Science topics are often the subject of posts to the ArcGIS Blog and Esri Insider blog, and new developments in the use of GIS for scientific research are Tweeted out from these Esri Twitter accounts: @deepseadawn (Esri chief scientist Dawn Wright), @esriscience, @GISandScience, and @ArcUser.
Working with the Scientific Community
Esri is committed to continually advancing the underlying science of GIS, improving how it is applied through Esri GIS technology, and supporting scientists who use this technology to understand and solve the world’s most important problems.