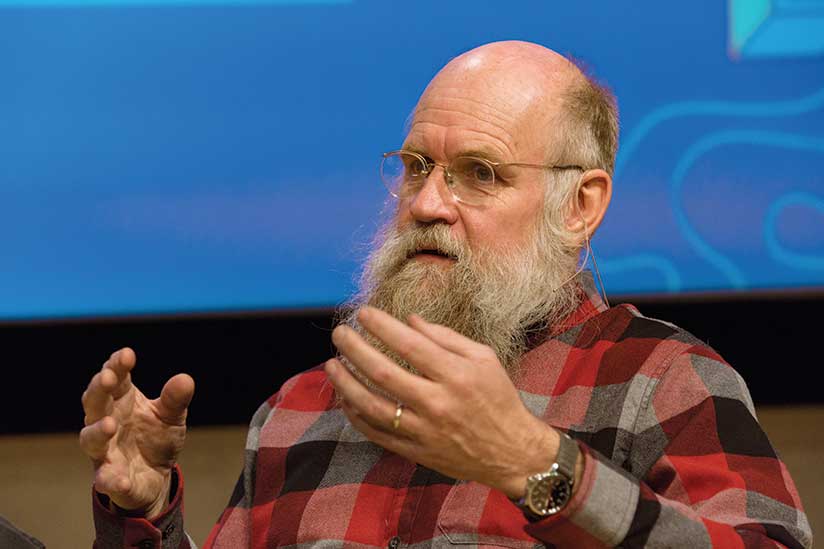
Scott Morehouse, a driving force in GIS development at Esri for many years, is designing new systems that have their roots in the past.
Scott Morehouse has spent more than three decades steering the software development ship at Esri. If you use ArcGIS, Morehouse had a big hand in bringing your software to life.
A geographer and computer scientist, Morehouse cut his teeth on computer mapping at the Harvard Laboratory for Computer Graphics and Spatial Analysis at Harvard University in the late 1970s. That’s the same lab where Esri president Jack Dangermond worked years earlier, though the two men never crossed paths there.
The lab, part of the Harvard Graduate School of Design, was an incubator for ideas on how to design and build computer mapping software. Morehouse was part of the team that developed ODYSSEY, a vector GIS and a forebearer of Esri’s first commercial GIS, ARC/INFO.
After meeting Morehouse at a conference at Harvard University, Dangermond hired the smart, young software developer in 1981 to design and launch ARC/INFO. Later, he worked on developing the ArcGIS product line.
Five years ago, Morehouse changed his role as Esri’s director of software development. He shifted his focus to small research and development teams at Esri that use GIS technology for civic engagement and urban systems. While the projects are new, the ideas behind them are rooted in Esri’s original mission when it started as a land-use consulting company in 1969: fostering well-informed urban design.
Morehouse and Dangermond both started their careers with a strong interest in data-driven land-use planning coupled with the idea of civic engagement. Morehouse’s work on frameworks for the Urban and Hub systems he is currently involved in stems from that interest. Esri recently launched the ArcGIS Hub product to support participatory government and has moved into the 3D GIS sphere in urban landscape modeling.
In an onstage conversation during the 2018 Geodesign Summit, held in January at Esri headquarters in Redlands, California, Dangermond asked Morehouse about this move, saying, “You’re rethinking the whole game?”
“I’ve gone back to basics,” said Morehouse. “I want to build systems that serve people—systems to guide, direct, or organize the civic process.”
Morehouse recently took time to talk more extensively about these projects. [His comments were edited for brevity and conciseness.]
What’s your role today at Esri?
Morehouse: I direct the Esri research and development centers in Washington, DC; Zurich, Switzerland; and Beijing, China. I have two initiatives I am working primarily on now: one is the Hub system framework, which is the environment for the citizen engagement and collaboration. The other is this urban system framework, which is about envisioning and supporting the development/redevelopment/planning process.
What does “going back to basics” mean to you?
Morehouse: We invent systems to solve problems and serve a community of people. That’s fundamentally where the GIS idea comes from: creating a system that can work with maps and geographic information that helps people do their work. It’s a cool set of concepts that have been used across different domains: cartography, forestry, military planning, city operations, and many others.
With our new work with the research and development of the Urban system and the Hub system, I’ve taken the same principles [into account]. If we want to create a system that helps a community of people work with their elected officials and their city government to more effectively manage their built environment and to accomplish other civic goals, what would that system look like?
Many people are applying a more generic GIS concept in urban governance and urban planning and local government use cases. As things have become more sophisticated from a technology standpoint, we realized that creating a system that focuses on the user’s needs, concepts, and workflows—and takes advantage of everything that we’ve done with the GIS platform—would be really useful and valuable.
So rather than have each customer assemble a civic engagement system from scratch using various ArcGIS software products, Esri could deliver basically a ready-made civic engagement system?
Morehouse: There’s an opportunity for Esri to deliver this as a well-designed system with a commitment to sustain it with initiatives and user experiences.
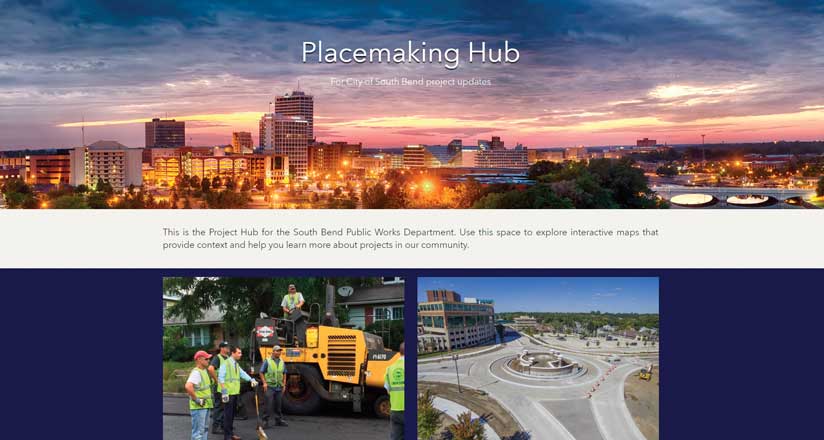
The cities of Los Angeles and South Bend, Indiana, have begun to implement this [Hub] idea. Hub is like GIS. It’s an idea for a process, and it is also technology that Esri is developing as a commercial off-the-shelf [COTS] framework or a product. And it’s also an implementation that individual cities can do.
How do open data capabilities fit into the Hub idea?
Morehouse: The addition of open data capabilities to the ArcGIS platform was the germ of getting people together around the table. If we just put some data in the middle of the table, then everybody could gather around that data. The activists and the startup companies and the different [government] departments could at least have a more intelligent conversation because it was data driven.
Everyone said, “This is great.” We thought that if we put the data there, wonderful things would just happen. And if you were [savvy] enough to know how to turn a spreadsheet into something interesting, you could do something there.
How many people [can] take a spreadsheet of trash collection [data] and turn it into understanding? [The question is], “How can we create a sustainable system framework for such applications?”
So something beyond creating open data sites needed to be done to spur more collaborative civic engagement?
Morehouse: Open data is an incredibly important part of the idea. However, Esri believes that intentional design of good systems is a hard job. It doesn’t just emerge magically from making data available. Design and a sustained implementation are essential parts of the process. So we said, okay, if having the information accessible and available in this collaborative way is a great idea, what is it that people really want to do? And how do we just not make these things be giant data dumps of semiobsolete information?
That’s what led us from open data sites to the Hub. With the Hub, the notion is that you basically have a purpose for making information available and for collaborating. And the purpose is what we call an initiative. Initiatives could be centered around affordable housing, homelessness, or whether building a new basketball stadium is a good idea.
If a city or utility wants to involve a community of collaborators from outside its organization—such as startups and citizens—what are the initiatives they want to tackle? An example people often use is Vision Zero for pedestrian safety. [Vision Zero is an initiative promoted by the City of Los Angeles through its GeoHub.] The vision is reducing pedestrian deaths. We can organize a lot of information and activities around that: identifying and fixing dangerous intersections, learning where and why pedestrian accidents are happening, and finding ways to get bicyclists and drivers to safely share the road.
Are there currently tools in ArcGIS Hub to collaborate interactively on initiatives?
Morehouse: Yes, there are collaborative tools within ArcGIS Hub, and more will be added. For a traffic safety initiative, you will be able to see, for example, a dashboard with traffic accident statistics, a map produced from an analysis that shows the safe streets and less safe streets, and an analysis of what have been identified as dangerous intersections. And then, here is a question [to answer]. Are there any dangerous intersections near you? If so, you can report them through this survey form. And here’s a series of meetings that will be taking place where you can meet the people who are drawing the stripes on your road that separate the bicycles from the cars. You can talk to them about what they are doing in your neighborhood.
Will Hub systems be designed to get people more deeply involved in the planning process?
Morehouse: People who are interested in participating and contributing can do so at a deeper level. Say you are in a bicycle club and you have a passion as an activist to help [planners] get the design right—you can join the group that’s associated with this initiative and do more: get access to data, make your own maps, and contribute those to the initiative page. That’s already starting to happen.
What’s coming next?
Morehouse: We’ve created this contextual Hub framework. We’ve made the data available. But it’s still difficult for people to build apps for the initiatives and figure out how to do this well. So we are building more functionality into ArcGIS Hub. Many [organizations] want to do surveys for their initiatives, where people can report things like dangerous intersections or report street trees that are damaged and need their cages fixed. So, we are going to build on it—not just build more initiatives but build user experiences that allow people that use the system to configure and manage their own initiatives.
What types of configurable user experiences will Esri provide?
Morehouse: We will provide opioid [abuse], homelessness, and Vision Zero initiative templates. There are also two economic development initiatives. One will help governments attract businesses to their communities. This is a template or framework that a city could use to feature or highlight their vacant office space or industrial or commercial land and attract investment. Every community has prime real estate they want developed and [officials] want to help people choose [sites] wisely. This initiative—with an accompanying configurable app—gives city governments the ability to show businesses that might want to locate in their community what the city can offer.
The second economic development initiative and app are designed to help cities showcase amenities and neighborhoods to help people who are considering a move to a community make informed choices as to where they want to live. People will be able to explore information about various neighborhoods, such as school and transit options.
The recent ArcGIS Hub release includes the two economic development initiatives, along with the tools to support them. We are in the early days with this Hub system. Over time, we will be doing more and more.
Please provide an overview of a 3D urban system powered with real-time information.
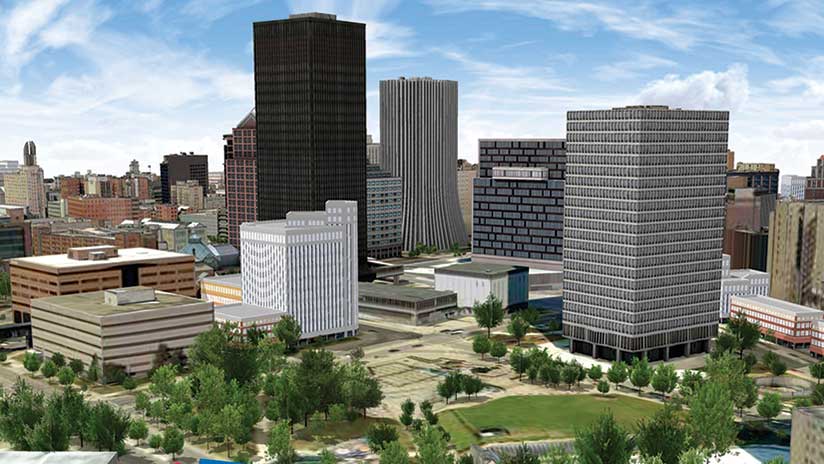
Morehouse: The Urban system framework is different from the Hub but related. People are very interested in and need to understand the life of their city or town—what’s happening now—and [want to] use that [real-world information] to plan and manage the development of the city as a good place for people to live and work. This starts with understanding in context. Where is the economic activity taking place? Where are the people who are at risk—the elderly, the sick, the homeless? Where is the infrastructure breaking down? Where are the roads in need of repair?
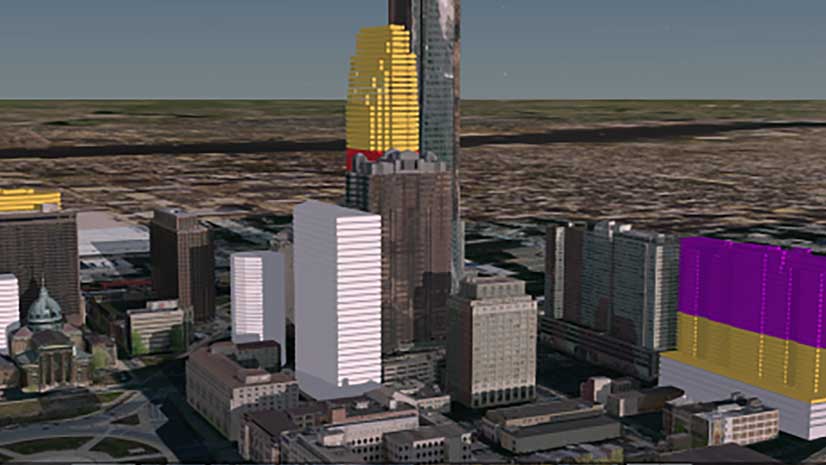
A lot of things can be considered as—if you will—instrumentation that you can place in the context of a model of your city. So, you can say, “Here’s my city and I can see where the at-risk people are and the elderly. I can see that [information] now in relation to our services in a 3D environment”—just how you communicate what’s going on.
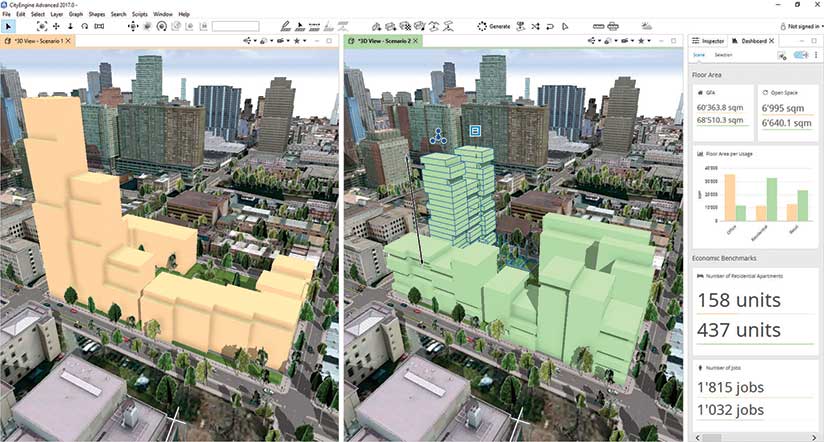
You have this picture of your city that you can visualize with what we are calling indicators. There are indicators that relate to the population. There are indicators that relate to the way the city is operating: Where is the trash collection [happening]? Where are we resurfacing roads? There are indicators that relate to the physical infrastructure of the city, to economic investment and revenue, and so on.
You want to be able to understand and visualize not only the state of this “urban landscape” but also the actions that we [as residents] are paying for or that we [as city officials] are managing or that we [as planners or architects] are supposed to design well.
All the people around the table are interested in the health and life of the city, as well as where the projects are and what the zoning is. That is another aspect of this Urban system we are looking at—it puts it in the context of making maps that communicate meaningful information.
Why is it important to consider city operations in 3D?
Morehouse: Because 3D just is what it is. Why is it important to know that the emergency medical services team goes to the eighth floor instead of the door of a building? If I am a real estate person, why is it important to know the price per square foot on the first floor versus the price per square foot on the fiftieth floor? Fundamentally, it’s clear that these things about how a city works start being three-dimensional.
The urban system framework starts with the principle that cities are three-dimensional. The only reason they were ever shown on 2D maps is because they did not have three-dimensional vellum when they started making [planning] maps in 1880. If the designers and planners of 100 years ago had what we have now, they would have done things differently.
Cities are three-dimensional first. What does that mean? The value of apartments in a building aren’t the same. The higher floors that overlook the park, for example, are more valuable than the lower floor. And more and more, mixed residential/commercial [projects] need to be fundamentally in a three-dimensional [view]. The units being rented, having values assigned, going through permit approvals, or generating 911 calls are spaces in buildings. They are not polygons on a map.
Are there other reasons that 3D models are important?
Morehouse: A 3D model of an urban landscape is also useful from a communication point of view. How many times have you seen the choropleth maps of census tracts—you know those colored polygons that show income, poverty, population density, and so on? And you are never quite sure where your house is because they are census geography. It doesn’t grab you.
But imagine if you saw a three-dimensional model of your city in which each set of buildings was colored by how many 911 calls were responded to at that building or how many permits were issued for kitchen remodels in this condo complex versus that condo complex.
Have you seen these walkability maps that people make for their city that show green areas where you can walk? Imagine if the buildings were colored by walkability rather than just the polygon colored by walkability—that would actually grab you—that building would be good to live in because it’s green.