GIS has improved the process of assigning students to schools and transporting them as well as managing physical assets for one of the largest school districts in Texas.
The Garland Independent School District (GISD) is located in north-central Texas, adjacent to Dallas. The district encompasses approximately 100 square miles and serves the Dallas suburb cities of Garland, Rowlett, and Sachse. With an enrollment of about 58,000 students, it is the thirteenth-largest school district in the state of Texas.
Enabling Choice
GISD’s “district of choice” policy allows parents to choose where their children will attend school, based on established criteria for ethnic balance. Annually, the district has a one-month selection period for both secondary and elementary schools. Once the selection period ends, the district’s Student Services department begins the process of assigning students to campuses based on building capacity, grade-level capacity, and seat availability. Other criteria, including campus demographic data, are considered before making the final decision on school placement. To help with student travel and support the district of choice policy, the district’s GIS department developed a Flex application for distance routing. With this application, officials can determine the location of a student’s home and local schools within the immediate vicinity.
Converting AutoCAD Files to Geospatial Data
Garland maintains 7 high schools, 12 middle schools, 47 elementary schools, and 2 pre-K schools, as well as a number of administrative offices and special-use facilities. Managing these facilities for compliance with governing standards, current use, past maintenance, and potential renovation and remodeling projects became increasingly difficult. It was decided that an automated system was needed to prepare plans and data for quick and easy access.
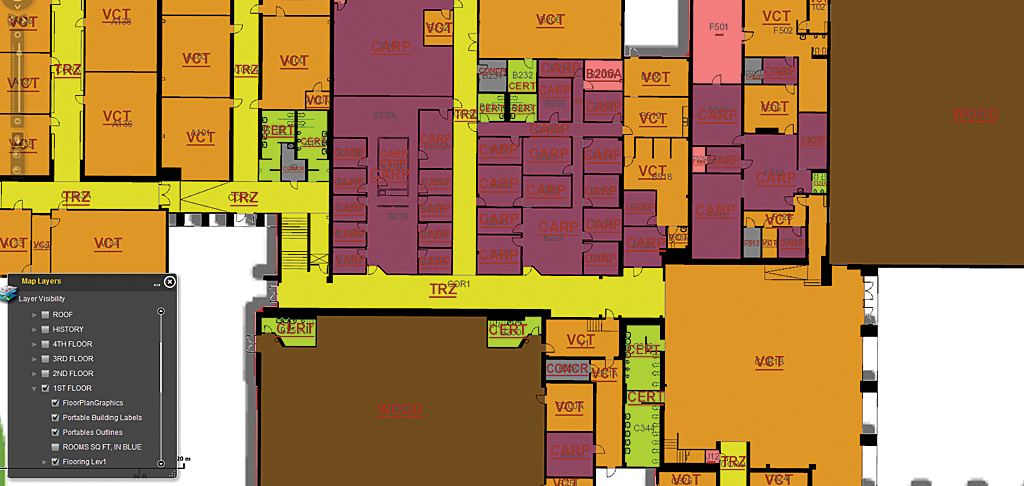
For several years, the district used Autodesk’s AutoCAD for facilities management. The district’s AutoCAD facilitator was responsible for converting all paper drawings into AutoCAD drawings and maintaining facility floor plans during the district’s $385 million bond program. Approximately four years ago, the facilities department began implementing a GIS to be used in conjunction with AutoCAD. The district retained all facility floor plans in AutoCAD while using GIS to provide easy access to site plans, floor plans, room numbers, and data referenced to them.
With the arrival of GIS analyst James Walker, the decision was made to create a separate GIS department and convert all existing AutoCAD site plans and floor plan files to Esri’s ArcGIS format to make greater use of the district’s ArcGIS for Server installation.
“Because we have used AutoCAD for so long, it is very important to us that the new GIS-based drawings look exactly like the CAD plans for easy visual recognition among staff members,” said Walker. “This means that all the details in the original files must be included in the new ones.”
Walker found the conversion process challenging because existing floor plans often included small features such as door swing paths, stairwells, and other details that totaled 30,000–40,000 polylines when converted to ArcGIS. For example, curves were made up of many very short line segments rather than a single continuous line. “When you brought a converted AutoCAD drawing into the geodatabase, it could take 10 minutes or more to draw because of its complexity,” said Walker. “So I built a module for our AutoCAD processing model to simplify the drawings.”
Walker’s module removes all the unnecessary polylines in the AutoCAD drawings by running a spatial buffer with a dissolve around it. Because he set the buffer value at one-quarter of a centimeter, he got a half-centimeter line on either side of the polyline. The result is that all the thousands of tiny polylines become one complex polygon that draws very quickly.
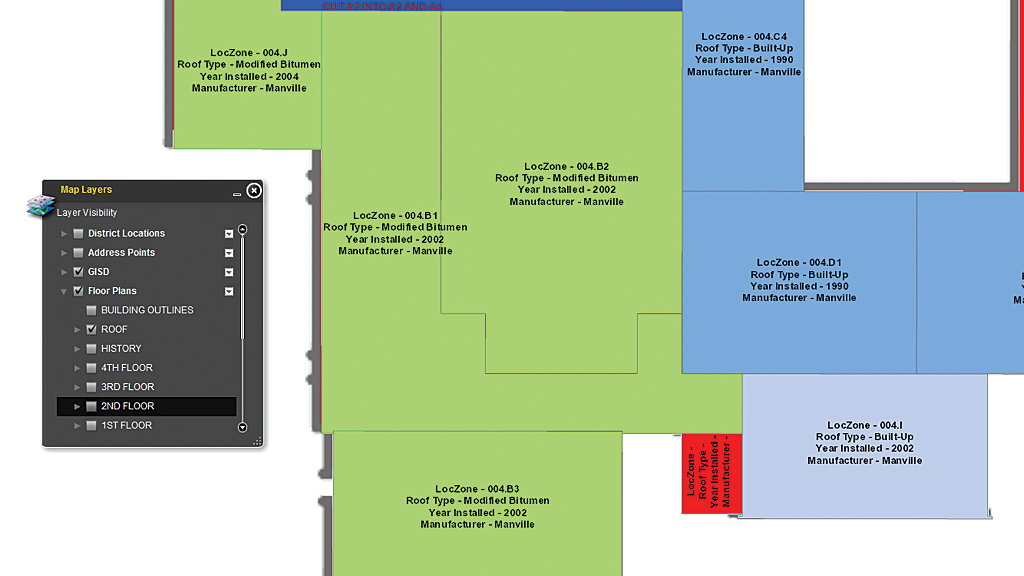
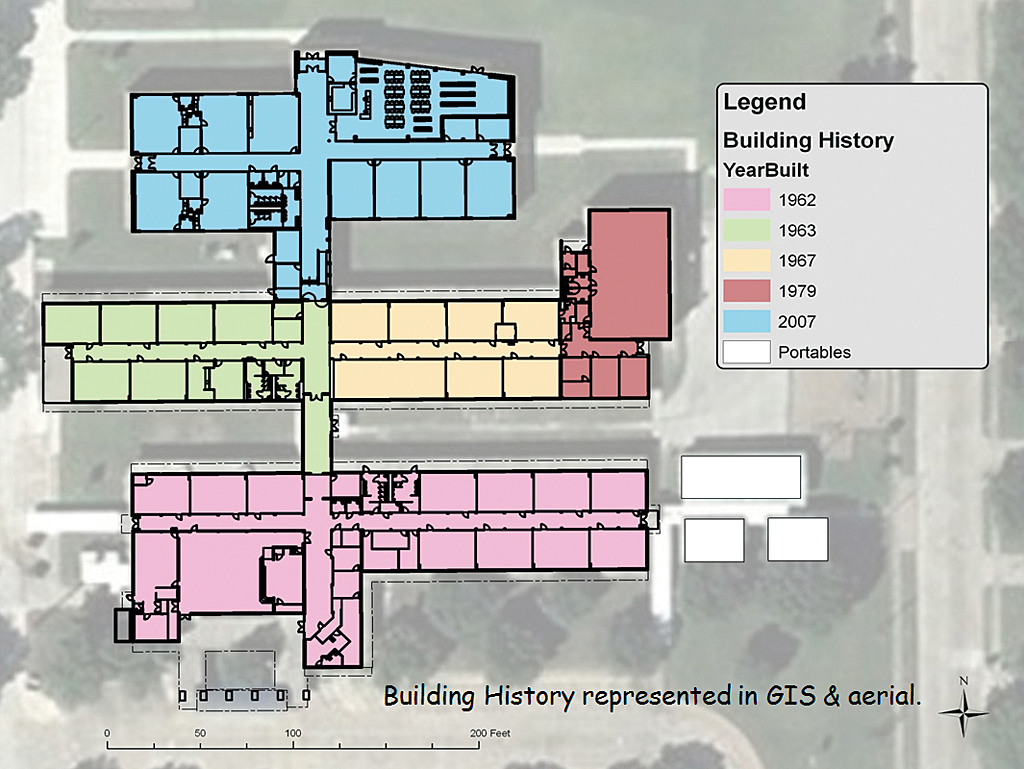
In addition, Walker uses Esri’s ModelBuilder to extract data from the AutoCAD drawings and create new layers in the geodatabase. “We apply structured queries to the polygons and annotations in AutoCAD to extract GIS feature classes from roof plan outlines and their related buildings,” said Walker. He used the same method on the construction history of both the original buildings and other structures that were subsequently attached to the original buildings. By doing this, he created about a half dozen new layers from the original AutoCAD files that could then be used to analyze the condition of district buildings.
Standardizing Room Numbering
Reconciling the various classroom numbering conventions found throughout the district was another significant benefit from implementing GIS. In the past, photocopies of school floor plans were distributed to the maintenance, security, technology, energy management, and other departments. The same photocopied floor plan could remain in use for several years, despite the fact that building renovations or modifications had occurred or the room numbering had been changed. In some cases, departments had different versions of the floor plan for the same school.
“Because the existing CAD system maintained multiple unconnected drawings for a school, there was no way to know whether or not a room number was used more than once,” said Walker. “So it was possible for a classroom on the first floor and a utility closet on the second floor to have the same room number.”
Another aspect of room number standardization is its impact on security and emergency response. School entrances and exits throughout the district are now numbered in such a way that they are in compliance with police and fire department guidelines. This allows first responders to react quickly and efficiently once they arrive at a campus. “We’ll soon begin to incorporate the new numbering system with GIS views and printed maps that relate to the current construction of each facility,” said Walker.
Thinking Outside the Classroom
Managing building use is an ongoing challenge in many school districts. Because demographic data is joined to the classroom a student is assigned to, it is possible to analyze the campus as a whole as well as individual rooms. Each building is reviewed annually in conjunction with enrollment projections, program offerings, and staffing requirements. For example, elementary schools often have both regular and English as a Second Language (ESL) kindergarten classes, but as students progress, the need for ESL classrooms begins to vary from school to school.
GIS is also used to analyze the building construction data collected so that the district can track the conditions of major building components, such as flooring; roofing; and heating, ventilation, and air conditioning systems. Data collected includes installation date, manufacturer, installer, and product information. This data assists various departments in developing their budgets for replacement based on the age of a component and aggregating yearly budget projections across the district for similar replacement work. This allows some basic life cycle costing of major facility components within the district. In future years, it will also provide valuable information for bond projections.
In addition, the GIS department recently helped the district’s transportation department with the implementation of a new GIS-based routing system. Currently, the district transports approximately 28,000 students on 250 buses daily, totaling 3.5 million miles per year. To supplement and enhance this system, GISD is using the ArcGIS Network Analyst extension to build an extensive street and sidewalk network.
“We are beginning to expand our use of GIS,” said Walker. “We plan to implement a GIS process for data collection. As we gather and centralize more data, we will begin to perform more detailed analyses with our data to better understand the dynamics of the district and provide increased services to school district employees and our students.”
About the author