Five years ago, the National Audubon Society, the century-old conservation group devoted to protecting bird populations and habitats, embarked on an ambitious plan to reinvent itself by using ArcGIS to change the way it collects and manages data.
With its roots in an 1890s movement to fight the slaughter of waterbirds for the hatmaking trade, Audubon started as a loose-knit network of state-level groups. It has long relied on that decentralized framework to enable a wide reach and empower local efforts. Unfortunately, Audubon’s federated structure—with 467 local chapters and a long roster of independent, grassroots conservation projects across the northern hemisphere—created significant data management challenges.
Reporting methods varied wildly, creating a haphazard assortment of data. Redundancies and flawed, even conflicting, datasets were commonplace. Despite the volume of information potentially available to decision makers at the regional and national levels, vital intelligence was still far out of reach.
“In that scenario, our [incoming information] wasn’t quality controlled,” said Doreen Whitley, Audubon’s geospatial information officer. “It was simply up to users, those generating spatial data, to do the best they could with the information they had. I could make maps, but I’d have to pull from back-of-napkin resources with no assurance of accuracy.”
Acquiring Situational Awareness
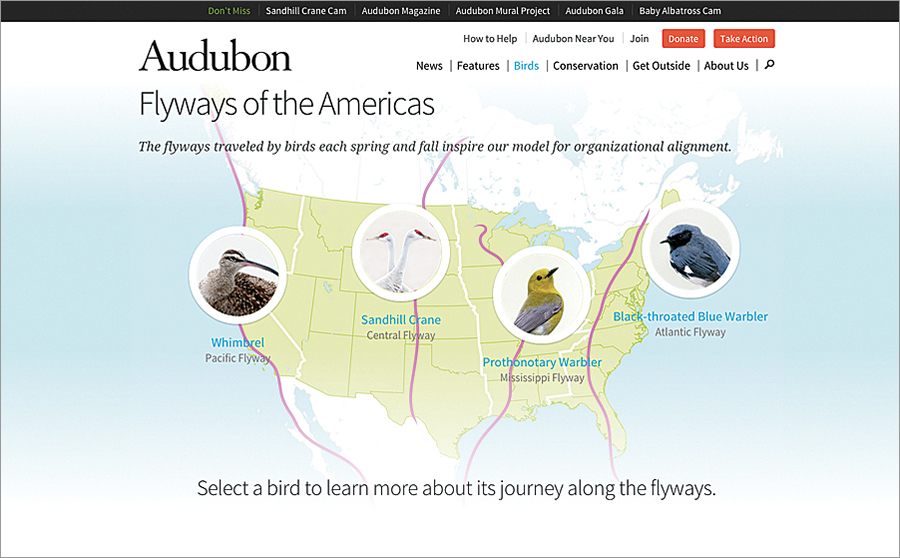
In 2010, Audubon’s leadership committed to pursuing large-scale conservation projects that would require situational awareness across multistate regions. The group restructured itself, creating a new organizational alignment based on four North American flyways, the north–south paths traveled by migratory birds each spring and fall.
State and local chapters typically pursued independent conservation initiatives that were based on strategies that seldom reached across state lines. Audubon hoped that under this new configuration, these chapters could begin to see their efforts in the context of wider regional pictures. This new approach would reduce redundancies and promote interchapter partnerships. The database required for such an overhaul, though, simply didn’t exist.
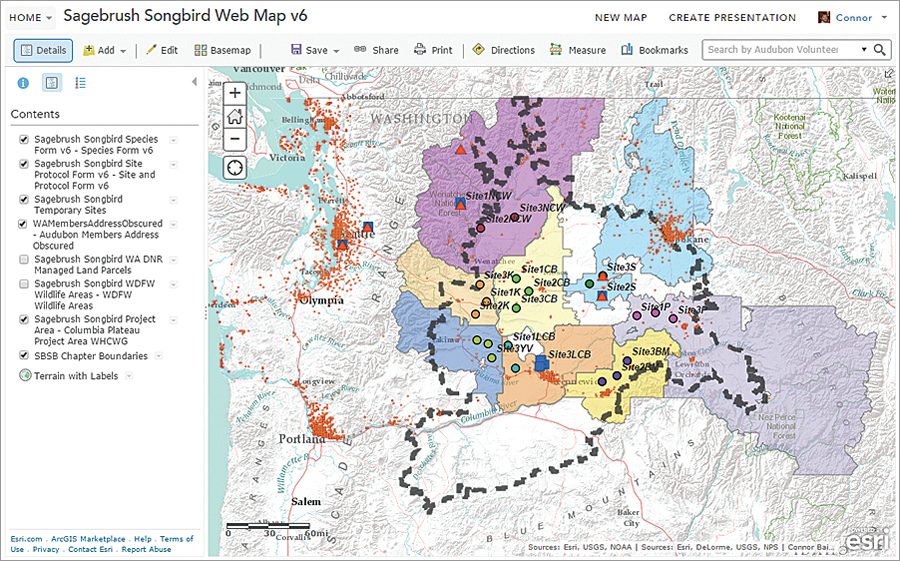
As the first step in its flyway-oriented retrofit, Audubon created an experimental protocol. Chapters in each north-south flyway systematically reported every four months on their progress with ongoing projects. Whitley led the effort to compile and organize the incoming data using ArcGIS to build—piece by piece—a comprehensive new picture of Audubon’s efforts.
“It was the first time [chapters] could see across state boundaries,” said David Yarnold, Audubon’s president and CEO. “What none of us expected was that this experience would trigger a series of management changes where a new generation of collaborative leaders took over and brought with them a ‘one Audubon’ approach to conservation that’s fired up our entire network of four million.”
The experiment set the stage for the development of enterprise GIS. This transition saw Audubon evolve from an organization with some 90 users of ArcGIS—each creating and managing spatial information on a local level—to an intelligence-centric culture with more than 1,000 network members using the Esri platform on a widespread basis to gain ownership of authoritative data.
That reinvention began with a cultural shift.
Molding GIS to the Culture
Audubon’s leadership faced a unique challenge: broadening the group’s use of GIS while staying true to the decentralized organizational structure that has allowed for efficacy at national, state, and local levels.
Tearing down that structure was not an option. An enterprise GIS strategy had to be molded to fit Audubon’s existing culture. In that culture, data management skills, data needs, and technology access varied chapter by chapter. Whitley knew that, for Audubon, GIS implementation would need to be both creative and agile.
“Our goal wasn’t to create more spatial data experts but to make it easier to access and use data,” she said. “For us, the starting point was the idea of the value of authoritative data. In any organization, whether it’s decentralized or centrally focused, the key is understanding that value and recognizing the datasets that drive your mission. Focus on those and flexible ways to distribute them. Everything grows from there.”
Whitley led an organization-wide exercise in identifying core spatial datasets such as species populations, habitat locations, migration patterns, and climate measurements. Unraveling the origins of these datasets illustrated the value of quality control in data management. The effort helped clarify for all players the importance of consistency and accuracy in gathering and sharing geospatial information. It brought the organization together, bonding personnel through a shared newfound trust in a single authoritative dataset.
“Soon everyone in the organization appreciated that there weren’t five answers to the same question,” Whitley said. “At that point, no one’s resistant, and people are looking to use geospatial data to create solutions. That’s how GIS builds connective tissue.”

Using this more accurate spatials data, Audubon’s GIS team created maps in ArcMap and published them to ArcGIS Server as map services so they would be available online for users throughout the organization. End users in local chapters could then incorporate the material into their own initiatives and campaigns. The value of Audubon’s data increased as its directional flow changed.
“Less content—what had been considered authoritative content—is created locally,” Whitley said. “Most core data is now accessed centrally. Authoritative spatial data is tied to the institution, not the individual.”
With an improved data structure in place, Audubon introduced specific GIS-empowered initiatives and retooled existing efforts to better use spatial information. The Important Bird and Biodiversity Area program—developed by the conservation group BirdLife International but administered in the United States by Audubon—identifies vital bird habitats. Historically, Audubon had relied on “stitched together” data arriving in the form of thousands of e-mails from sources working at various levels within the organization and using differing criteria in evaluating bird populations and threats.
With enterprise GIS, users at Audubon’s state and local levels can now access the most recent national data via a shared server. They can check out data, edit it, and check it back in, thus contributing to the ongoing refinement of a single, reliable dataset.
Lights Out Program
Audubon’s Lights Out program works to mitigate the risk that migrating birds will be killed at night by flying into tall buildings. Many bird species migrate at night and rely on the moon and stars for navigation. Brightly lit windows in tall buildings can disorient birds, causing them to be killed when they strike urban structures. According to Audubon, more than 100 million birds die annually from such strikes.
Prior to Audubon’s widespread adoption of GIS, volunteers monitoring buildings for signs of overnight bird strikes might have compiled data consisting of little more than the building’s address. Now, volunteers can use Collector for ArcGIS to record specific strike locations on a building’s exterior. Audubon has begun using Esri’s CityEngine to model the environments in which these strikes occur.
“We bring in collected data, reprocess it as a feature class, then bring it into CityEngine,” Whitley explained. “The end product is a 3D model of a strike location, which allows us to make better recommendations in lighting changes.”
The technology has changed the tone of Audubon’s conversations with building owners. Rather than issuing a blanket request that all lights in a building be turned off overnight, Audubon can present what Whitley calls “a more reasonable ask” to limit lighting in specific locations on specific floors. That change in tone has actually brought many building owners on board as voices for the Lights Out cause.
Largest, Longest-Running Animal Census
Audubon’s Christmas Bird Count (CBC), a century-old citizen science program, still relies on bird population numbers generated by volunteers and submitted as tabular data. Nonetheless, CBC has been reformed through GIS. Data is vetted at the national level, added to a single database, and can be mapped on demand. The effort illustrates how Audubon has balanced technological progress with the preservation of its culture.
“One reason a lot of NGOs are decentralized is that you have people who care about the same things, and they start grassroots efforts locally,” Whitley said. “As the organization scales up, you get a bit of disconnect in things like spatial data skills. With the CBC, volunteers manage everything that goes on in their circles. GIS plays an important role for the national-level staff and biologists who vet incoming CBC data and provide volunteers with the maps they need to coordinate work in their circles.”
“People don’t realize the CBC is the largest, longest-running animal census on the planet,” Yarnold said. “GIS helps us better organize the work of thousands of compilers and volunteers and makes [data] available much more quickly.”
GIS has enabled Audubon’s science teams to conduct sophisticated spatial analyses of bird ranges and determine how habitats and migratory patterns could change under a variety of future climate scenarios. Enterprise GIS has allowed climate/habitat data to be distributed within Audubon’s network with greater efficiency and effect. Chapters can now internalize data produced by scientists working at the national level, and repurpose it for use locally.
Even Audubon’s fund-raising and recruitment efforts have been reformed by GIS. Spatial data analysis offers new perspectives on donor histories, demographics, and projected outcomes for future campaigns.
Going forward, Whitley said, Audubon expects to make greater use of 3D mapping. CityEngine’s 3D capabilities are effective in illustrating birds’ airborne environments, but Whitley expects that 3D’s strength as a storytelling tool—equipping viewers to see habitats and threats through the eyes of a bird—will further aid Audubon in its advocacy efforts. Boosting local volunteers’ skill levels in using Collector for ArcGIS and in creating compelling Esri Story Maps, she added, will likewise lead to more effective communications with the public and with policy makers.
A More Collaborative Approach
“We see opportunities in these 467 chapters, with the volunteers that have committed to the organization,” Whitley said. “The more we can arm them with technology, the stronger their voices will be and the more successful they’ll be.”
Yarnold sees GIS as a vital component for nonprofits of the future. He said that organizations like Audubon will always reflect the visions of their leaders, but he adds that, in groups that embrace GIS, those visions can be shaped, refined, and strengthened by meaningful data. He expects GIS to enable nonprofits to move away from what he calls traditional models—those in which advocacy heroes make decisions while other participants are relegated to supporting roles—and shift toward more collaborative approaches in which all players have the tools and data to participate in strategy making.
Rising to a leadership role within Audubon, Yarnold asserts, now requires a belief in collaborative goal setting and clear metrics. He expects GIS itself to become a basic part of the skillset required for the group’s decision makers.
“Our culture change [was achieved] using data to level the playing field and let science lead the way,” Yarnold said. “GIS is a creator of baselines and a truth teller, an objective view of opportunities and challenges. The bottom-line payoff is trust and confidence that we’re using the best available science to inform our conservation decisions.”
About the author