An ArcGIS-enabled resource broadens understanding of business’s “last dark continent.”
In the spring of 2012, Thomas Horan, dean of the Drucker-Ito School of Management at California’s Claremont Graduate University (CGU), found himself at dinner with the late James Oberstar, a former United States Representative for Minnesota, and Matt Rose, then CEO of the railroad giant BNSF Railway Company. Something of a debate took shape.
Oberstar, who served for four years as chairman of the Transportation and Infrastructure Committee, asserted that greater public-sector investment in the United States’ freight-rail infrastructure was needed and that such support deserved to be recognized as an essential economic driver. Rose countered that private-sector investment in moving goods and services by rail was more critical to economic progress.
“It was a My Dinner with Andre experience,” Horan said, referring to the film in which a simple over-dinner conversation results in unexpectedly broadened world views for those at the table. In weighing Oberstar’s argument for public-sector freight-rail support against Rose’s advocacy for private investment, Horan—a public-policy specialist whose work has influenced health care legislation as well as transportation policy—arrived at an epiphany that came in the form of a third point of view: “They were both right.”
As the conversation progressed, the three agreed that an easily accessed information source—one tailored to an audience that could include legislators, business leaders, and freight analysts—was needed to foster a greater understanding of the United States’ freight infrastructure, its effect on the economy, and the value of both public and private investment in freight-rail capacity. Such a tool, they theorized, could also improve private-sector comprehension of the potential of freight rail and create opportunities to improve the freight-rail infrastructure by identifying efficiencies and weaknesses in the movement of goods.
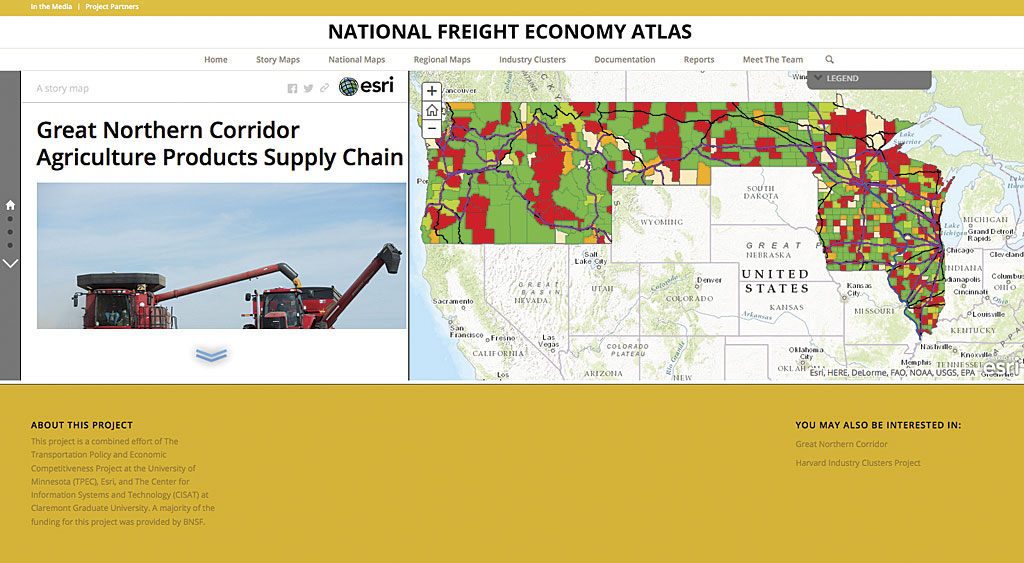
That moment of inspiration has led to the National Freight Economy Atlas, an ArcGIS-powered online resource developed by a partnership that includes Claremont Graduate University, Esri, and the University of Minnesota, with financial backing from BNSF Railway and the State of Minnesota. With a menu of interactive maps, the atlas illustrates relationships between commodity sources and the United States’ freight infrastructure and offers tools to gain an improved grasp of concepts like industry clusters—sets of interconnected stakeholders within a geographic area—and location quotients, economic ratios comparing regional attributes to those of the country as a whole.
“There’s been attention to the technical and logistic aspects of supply chain—how to get things from here to there, how to optimize [routing]—all of which is important,” Horan said. “There hasn’t been a broad understanding of the spatial aspects of supply chain, and the National Freight Economy Atlas has allowed us to [offer] that in ways easily understood. Our target audiences are the decision makers handling not only those technical aspects but also the policy, organizational, and corporate aspects—maximizing value, making it all happen, and working with various companies throughout a supply chain to deliver [a] quality enterprise.”
Prior to his work with the National Freight Economy Atlas, Horan had already earned a reputation for creating innovative platforms with which to share critical data with the public. In 2008, he codeveloped, with CGU professor Brian Hilton, the website Safe Road Maps, which presents mapped data—state by state and even street by street—on traffic fatalities and auto accidents. [See “Mapping Roadway Fatalities—Website increases awareness and understanding” in the summer 2012 issue of ArcUser.] By simply zooming in on a particular geographic location, site visitors can call up historical information on accidents that have occurred along a particular route, allowing them to gauge travel risks. Demand for such information was so strong, Horan said, that on the site’s launch date, several additional servers had to be brought online to handle the unexpected user volume. To date, he estimates, the site has earned more than 15 million hits.

“We took this data—which had existed in a data warehouse but had not been mapped—and enabled understanding by the public,” Horan said. “When you can do that, those are great moments. It’s inspiring to see a situation and realize GIS and spatial analysis will represent a breakthrough moment.”
In the challenge that emerged from his conversation with Oberstar and Rose, Horan recognized a similar opportunity to foster awareness—in this case, of the economic value of freight—by again using GIS to deliver data in a fashion meaningful to a mainstream audience. He envisioned an approach modeled after the Dartmouth Atlas of Health Care, an online resource offering geospatial data on medical procedures, health care access, and costs.
“Dartmouth’s health atlas has had a huge impact on health care policy over the last 20 years, charting spatial disparities,” Horan said. “If they could do that, we could do that for supply chain.”
Work on the National Freight Economy Atlas, began within a GIS practicum course—in which students develop GIS-based solutions for real-world challenges—at Claremont’s Center for Information Systems and Technology (CISAT), then moved to the Advanced GIS Lab at CISAT, headed by Professor Hilton.
Using data from the Bureau of Economic Affairs, the Freight Analysis Framework (produced through a partnership between the Bureau of Transportation Statistics and Federal Highway Administration), and the 2012 United States Census Commodity Flows Survey, the atlas identifies major industry clusters within a state and uses location quotients to provide measurements of a state’s industrial specializations. That data is depicted in relation to local freight-intensive routes that lead to major freight-rail corridors.
“We use ArcGIS for Desktop to create the basic maps,” Hilton explained. “We then publish them online as map services using ArcGIS for Server. We use ArcGIS Online to organize and manage them, and then publish them as story maps using various templates.”
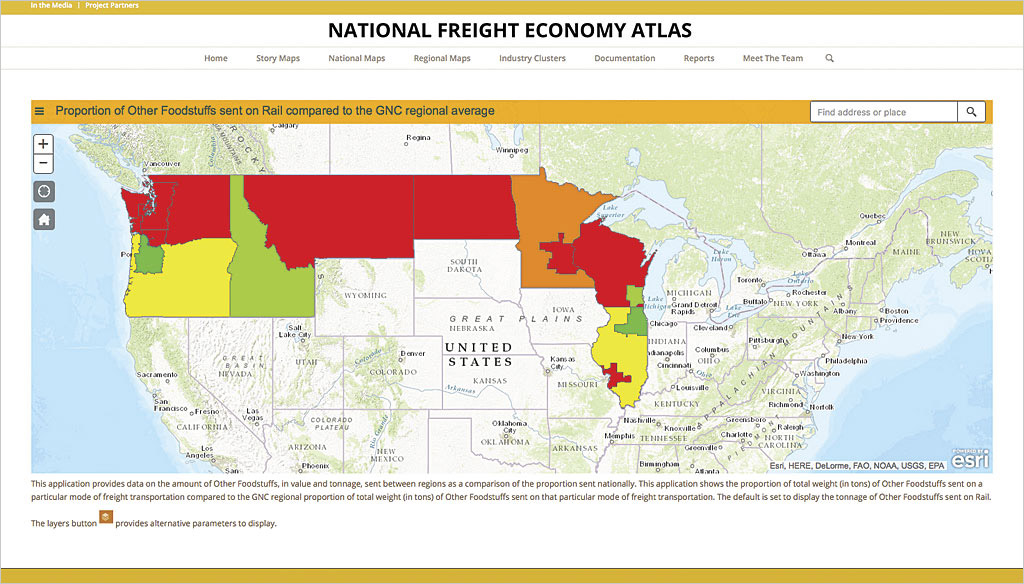
The resultant analytical picture, Hilton said, provides a “specialized understanding of commodity movements within and between regions.” Using United States Department of Transportation data, the atlas goes further, identifying the proportion of a region’s production associated with freight movement and helping create a picture of the economic impact of that freight traffic.
“[A region’s] trading clusters can really leverage economic growth,” Horan said. “Two-thirds of the economic growth in this country [can be attributed to] trading clusters. With the National Freight Economy Atlas, we’re taking on some of those clusters and showing local communities that the business around the corner—because it’s part of a trading cluster—is really important, as is the supply chain around it.”
Horan points to an example: Due to the demand in China for commodities, Minnesota’s grain industry has outpaced urban-based industries in the economic rebound. “Farms in Minnesota are doing great because China buys their soybeans,” he said. “A community getting new jobs in rural Minnesota is getting those jobs because of grain being delivered by BNSF. We’re able to show, through maps and analysis, that [this industry cluster] is important.”
Horan expects the atlas to help mainstream users achieve a greater awareness of supply chain concepts. Such a need is especially apparent, he explained, among policy makers and legislators.

“I’ve worked on transportation policy on Capitol Hill,” Horan said. “There isn’t a good understanding of the spatial dimensions of supply chain—across states, across the country—or how policy affects economic value. Through these story maps and cluster analyses [published on theNational Freight Economy Atlas], we give a sense of understandability to the idea of supply chain.”
Early response to National Freight Economy Atlas, he adds, has been especially strong among state-level policy makers and administrators responsible for investments in and long-term planning for rail infrastructure, as the atlas has provided a tool with which to observe and quantify both the demand and the untapped potential for freight rail services. Horan contends the site also gives weight to arguments for public-private partnerships that can enable trading clusters and supply chains, “or at least not thwart them.”
Next, Horan hopes to expand thr National Freight Economy Atlas‘s scope to include data and analysis of other transportation modes, beginning with air freight. He and his National Freight Economy Atlas collaborators have been working with Federal Express on strategies to illustrate the value of the air-freight infrastructure in moving high-value, low-weight products.
As vital as GIS has proved in the development and presentation of National Freight Economy Atlas and as a platform for the wider analysis of supply chain, Horan and Hilton agree that its full potential is still unrealized.
“GIS has impacted the supply chain and logistics field, though it seems more at the descriptive levels of analysis and decision-making: what happened, and why did it happen?” Hilton said. “Where I see it making an impact in the future is in the predictive and prescriptive levels—what is going to happen, and what should we do about it?”
Given the fundamental nature of supply chain and logistics—fields devoted to moving goods over distances—Horan foresees moving past a stage at which GIS fuels operational research and into an environment in which the tools of geospatial analysis are ubiquitous across the shipping industry. GIS, he contends, has the potential to conquer what the renowned management theorist Peter Drucker—the “Drucker” in Claremont’s Drucker-Ito School—regarded as one of the business world’s greatest challenges: attaining a full comprehension of the science of moving goods.
“Drucker called logistics the ‘last dark continent,'” Horan said. “It was a black hole. But through GIS and the visualization it offers, we can deliver an everyday understanding to companies and governments of the importance of supply chain. That’s not just an operational issue, but really a value issue for companies and the communities in which they operate.”
About the author