Sound methodology underpins GeoEnrichment
Simply clicking on a map in the Esri Insights app brings up attractively formatted information on demographics, lifestyles, and even the landscape without requiring any serious analysis on your part. However, when you are using Esri Insights, Esri Maps for Office, or any of the other Esri Location Analytics solutions, you are taking advantage of a sophisticated geodata retrieval methodology called data apportionment.
Data apportionment is a function of the GeoEnrichment service available through the ArcGIS REST API. The GeoEnrichment service uses Weighted Block Centroid geographic retrieval, a special methodology for aggregating data for rings and other polygons. With this methodology, data points within an area of interest are weighted more heavily than points outside that area. When the service aggregates data, the results are statistically adjusted to more accurately reflect the actual statistics within the area of interest.

It Starts with Census Blocks
Like Russian dolls, census blocks are nested within census block groups, which in turn are nested within census tracts. The census block groups and the census blocks are the key input for data apportionment. Census blocks are the smallest geographic unit used by the United States Census Bureau.
Every census block has a centroid representing the center of the block that is sometimes called a block point. Think of this geographic point as the hub for all data collected for the census block. The shape of a census block is often determined by physical entities, such as streets or rivers, and administrative boundaries, such as school districts.
An easy-to-understand example of a census block is the city block, which is bounded by four streets. In rural areas, the edges of a census block are more likely to be defined by a combination of physical and political boundaries that result in census blocks with irregular shapes.
How Data Allocation Works
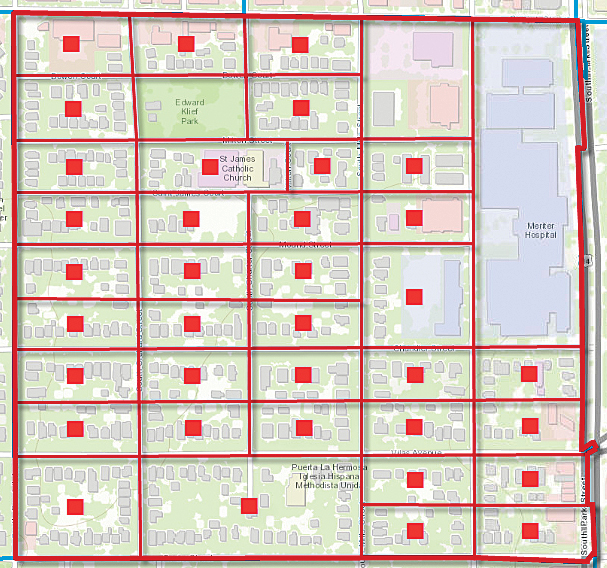
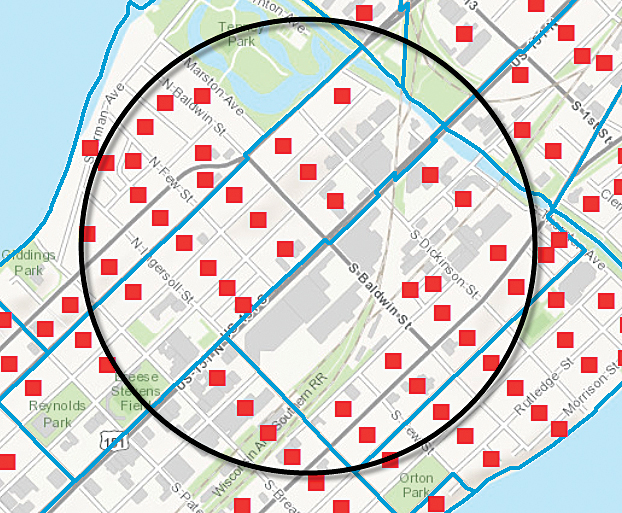
This example will help you understand how census blocks and block groups are used in data allocation. Imagine you want to get statistics on households by income for a one-mile ring centered on the intersection of two streets. As shown in the example in Figure 2, the ring touches 12 block groups but completely encompasses only 4 of them. The other block groups are only partially inside the ring, though block points for some of those block are in the ring.
For those partially included blocks, the GeoEnrichment service uses data apportionment and the weighted centroid retrieval method to calculate the approximate statistics for those portions of block groups inside the ring. It considers all the block points within each block group touched by the ring but weights the block points inside the ring more heavily. The results are added to the population statistics for the block groups completely inside the ring to provide an aggregated set of statistics on the area of interest encompassed by the ring.
Data apportionment becomes especially important when you’re investigating areas that have irregular shapes such as generated drive times, custom areas that you have drawn on the map, or areas that you derived from other data such as fire perimeters or flood zones.
Do It Yourself
You can try this yourself using the Esri Insights app. In this quick tutorial, you’ll use Esri Insights to analyze demographics within a ring, a drive-time area, and a custom area. The statistics are calculated for each of these areas using the GeoEnrichment service. All you’ll need is an ArcGIS Online account so you can access this online app.
Step 1—Open Esri Insights
- Sign in to the ArcGIS Marketplace with your ArcGIS Online user name and password.
- In the Search box at the top of the page, enter Esri Insights and click the search icon.
- Click the Esri Insights tile. On the Esri Insights description page, click the View Item button, click the Open button, and click View Application.

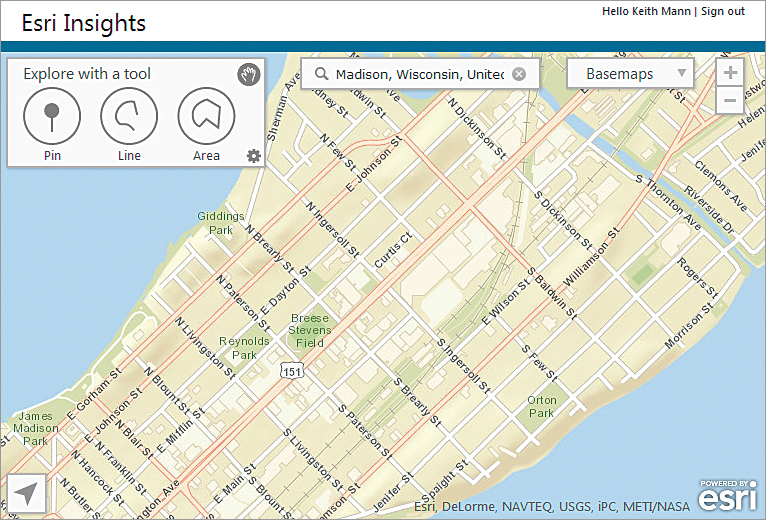
Step 2—Find an area of interest and dig deeper
The examples illustrated use Madison, Wisconsin, but you can use any area that interests you.
- Zoom in a little so that you can easily see street intersections.
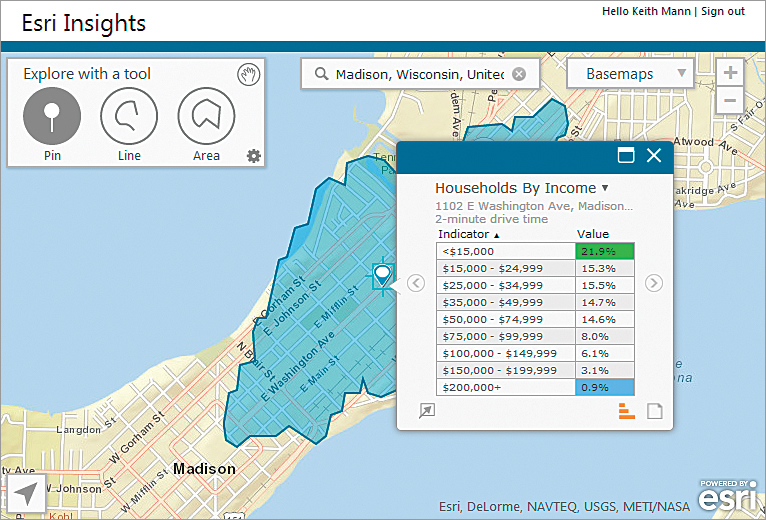
- Click the Pin tool to select it, then click a street intersection. In the infographic pop-up that appears, click the double pop-up icon in the upper right-hand corner to shrink the size of the pop-up.
- Next click the Zoom To button. You can page through the infographics by clicking the arrow buttons on the left and right of the pop-up.
Although you can’t see the census block groups, blocks, and block points, Esri Insights is using that data via GeoEnrichment to calculate statistics and present the results to you as infographics.
Step 3—Change to a drive-time study area
By default, Esri Insights uses a one-mile ring as the initial study area, but it allows you to change the infographic resources, type of area, and size of area.
- Click the Configure button in the right-hand corner of the Explore with a tool box.
- In the Configure Infographics panel, change Show data for: to Drive Times and Radius to 2 minutes, then click OK.
- Page through the infographics again and notice any differences in the statistics. When you’re finished, close the pop-up.

Step 4—Create a custom study area
- This time, click the Area tool. Create a custom area by clicking on the map and stretching out the polygon perimeters.
- Try defining your area by following physical features like streets or rivers.
- Once again, page through the infographics and notice any differences in the statistics.
- When you’re ready, sign out of Esri Insights.
Conclusion
Esri Insights and other Esri Location Analytics solutions make troves of useful statistical data for areas you define instantly available using the analytical capabilities of GeoEnrichment service, which lets you answer questions about locations that you can’t answer with maps alone.