Format supports decision makers and better outcomes
An institute at the University of South Carolina is using an interactive format for distributing health-related data that characterizes the communities served, their needs, and the resources available so decision makers and other stakeholders can explore this data at various levels of geography.
The Institute for Families in Society (IFS) conducts research with various partners to reduce child abuse, strengthen and engage families and communities, and improve the health of vulnerable populations. IFS, in collaboration with the South Carolina Department of Health and Human Services, is developing dynamic Adobe PDF environmental scans containing extensive demographic, population health, and health services data at regional, county, and ZIP Code Tabulation Area levels. These interactive, embedded PDF products effectively organize and distribute relevant, spatially referenced information for use by health care providers, administrators, patient groups, and others working to improve access to care and health outcomes for vulnerable populations across the state.
Complex spatial decision-making processes typically require large volumes of data from wide-ranging sources at multiple geographic scales. Effective decision making may also necessitate data sharing, exploration, and interpretation by diverse stakeholder groups. Dynamic PDFs, organized by geography, provides greater context for these end users.
Enabling Interactive Discovery
When developing a geographic information product for widespread distribution, IFS faced a number of challenges. End users needed not only to access but also explore an extensive set of data that characterizes the population, health needs, and health resource environment of South Carolina at regional, county, and local levels.
To allow for interactive discovery of critical geographic distributions and patterns, most data elements had to be dynamically mapped. Mapped data, as well as supplemental data, had to appear in easily navigated, georeferenced tables. Detailed metadata was required to identify data sources, highlight data currency, and define terms and the data transformation methods. User-defined maps, data tables, and metadata all had to be preformatted and printer ready.
End users had little or no experience with GIS software and often had no access to commonly used GIS resources. Some lacked administrative rights on their machines and could not install software. Lack of Internet connectivity for several key users and restricted Internet access for others precluded a general web-based information dissemination strategy. Instead, they needed an easy-to-use, stand-alone, encapsulated geographic information product that could be easily distributed via e-mail, USB flash drive, or DVD.
Accessible, Interactive Format
Building on the native capability in ArcGIS for Desktop to export to the familiar and widely used Adobe PDF file format, IFS developed a GIS-based environmental scan tool that met all end-user requirements. This product provides data-rich, interactive mapping capabilities with georeferenced data tables and extensive metadata all in a single embedded PDF document of less than 15 MB.
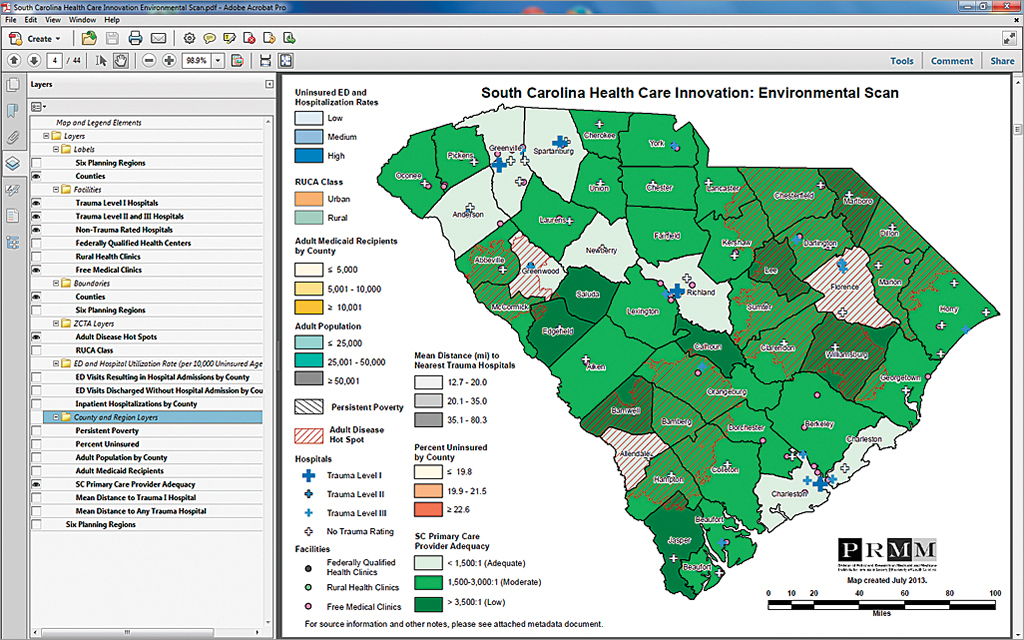
Separate county- and ZIP Code Tabulation Area (ZCTA)-level maps permit users to visually analyze dozens of spatial data layers providing the location of critical health care facilities such as hospitals, federally qualified health centers (FQHC), rural health clinics (RHC), and free medical clinics (FMC). These maps also supplied access to demographic data from the American Community Survey indicators of socioeconomic disadvantage; population characteristics and projections from Esri updated demographics; and data on disease prevalence rates, disease cluster hot spots, and measures of health care accessibility.
Each of these layers can be turned on and off, allowing users to explore individual data elements of interest and overlay multiple layers. The maps also contain dynamic label sets and regional, county, and ZCTA boundaries. PDF bookmarks organize map layers into logical thematic categories facilitating navigation of this extensive spatial data content. Dynamic titles and legend headings automatically reflect user selection of one or more spatial data elements in preformatted map layouts.
The dynamic PDF allows users with no cartographic training or experience to create and share customized, high-quality maps that reflect stakeholder-specific perspectives, objectives, and needs. Mapped and nonmapped (supplemental) data appear in geographically organized and referenced tables. Comprehensive metadata, bundled into the dynamic PDF, ensures ready access to important underlying information about data and methods used in the scan. The PDF format prevents users from inadvertently altering data and ensures environmental scan data integrity. Users can print selected pages of the scan (customized map views, for instance) or the entire pre-formatted document.
Creating Environmental Scans
A variety of software was used to develop the dynamic PDF environmental scan. Numeric processing and database management operations were performed using ArcGIS 10.1 for Desktop, Microsoft SQL Server, and SAS statistical software.
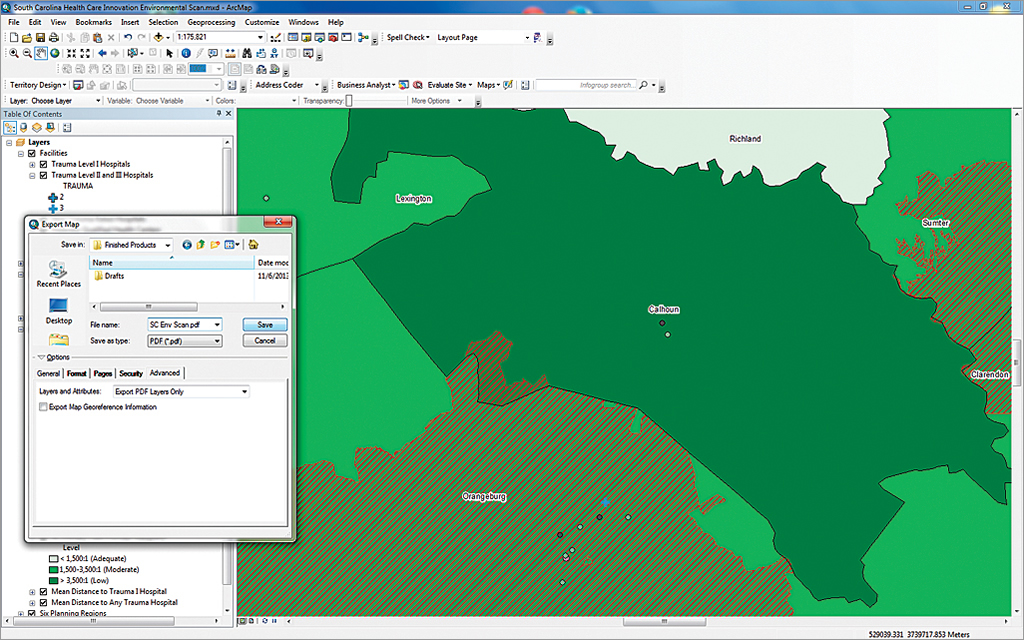
ArcGIS also was used to geocode health care provider and population locations as well as conduct network (Origin-Destination Cost Matrix) and spatial statistical (Getis-Ord Gi* Hot Spot) analyses to derive additional scan data elements. All cartographic content was developed using ArcGIS. Maps were exported from ArcGIS using the Export to PDF with Layers function.
Data tables and metadata were formatted in and exported from Microsoft Excel. Adobe Creative Suite applications were used to design cover and data usage pages and to enhance key graphics. Finally, all input files were consolidated and organized in Adobe Acrobat Pro to create a single PDF document. Despite the relative sophistication of this development strategy, end users require only Adobe Reader to interactively explore a complex array of georeferenced data that can be turned off and on to build customized printed maps.
Uses beyond Health Care
To date, IFS has developed and distributed interactive PDF environmental scans to promote innovative local health care provider collaborations, target high-risk populations for community health worker interventions, and strengthen state and local efforts to improve birth and maternal health outcomes.
While clearly useful for population health and health services planning and evaluation, these same dynamic PDF methods can facilitate more general needs and resource assessments, as well as strengths, weaknesses, opportunities, and threats (SWOT) analyses. They may prove equally valuable areas as varied as education, social welfare, criminal justice, urban development, environmental justice, and natural resource management for site selection, resource allocation, prevention, and intervention efforts.
By engaging diverse stakeholder groups with a shared information product, an interactive GIS-based PDF can increase stakeholder involvement and consensus, foster broader data sharing arrangements, and prompt context-relevant questions for subsequent investigation. Some of the questions raised by dynamic PDF users may be more thoroughly examined using desktop, server, or web-based GIS tools. In this way, dynamic PDFs complement existing GIS resources and may encourage more widespread community utilization of GIS-based strategies to support collaborative, data-driven decision-making processes at state and local levels.
For more information, visit the IFS website or contact Ana Lòpez-De Fede.
Acknowledgments
The authors acknowledge the South Carolina Department of Health and Human Services and the Division of Policy and Research on Medicaid and Medicare at the University of South Carolina’s Institute for Families in Society for providing support and the data needed to produce this article.
About the authors

John Stewart

Jared Shoultz

Ana Lòpez-De Fede