
Curated, authoritive elevation data, coupled with analysis tools, is now available via ArcGIS Online. Elevation analysis is readily accessible across the ArcGIS platform in ArcGIS Online web maps, in ArcGIS for Desktop, and incorporated in custom web clients.
Elevation analysis is essential for many GIS applications including those for natural resource management, conservation, agriculture, transportation, construction, flood risk management, and national security.
Traditionally, running analyses, such as drawing an elevation profile of a track, required a user to locate an available and appropriate elevation dataset. This could be a time-consuming process. Often elevation data is only available from individual government agencies and may come in a variety of formats and in a range of resolutions.
To perform more advanced analysis, such as to delineate watersheds or to trace water flows, additional work preprocessing elevation data to make it suitable for hydrological modeling and analysis was required. The process of deriving hydrologically-enforced elevation data requires rigorous methods and quality checks, significantly increasing the complexity of this type of analysis.
With the ArcGIS Online Elevation and Hydrology Analysis Services, which were made available in the ArcGIS Online December 2014 update, users can now perform these analytical tasks quickly and easily without having to collect, maintain, or update terabytes of base data on local machines.
What Are These Services?
ArcGIS Online Elevation and Hydrology Analysis Services are hosted by Esri. Both services are accessible through the ArcGIS platform when an Internet connection is available. This means users can retrieve elevations or calculate viewsheds for any point in the world using just a web browser.
In addition to hosted elevation and hydrologic data, ArcGIS Online also furnishes a collection of related analytical tools as geoprocessing services. ArcGIS Online users can perform elevation and hydrologic analysis in a web app and answer questions such as
- What is the elevation along a particular path?
- What is the slope of a road?
- Which areas are visible from an observation tower?
- What direction and path will water flow from a certain location?
- What are the origins of water that arrives at a specified location?
A key benefit of using these services is that all data used for analysis is hosted and maintained by Esri in one place. This data is already preprocessed and optimized for fast web service performance, and its worldwide coverage is available in different resolutions.
Using ArcGIS Online Analysis Services
ArcGIS Online Elevation and Hydrology Services are available as part of the Esri Living Atlas of the World. The services, accessed through the ArcGIS platform, are available to all ArcGIS Online organizational users, ArcGIS for Desktop users, and users of other web clients.
Here are just a couple of examples that demonstrate how these services are used. In just a few steps, these services can be used to generate an elevation profile and a viewshed and perform a watershed analysis.
Elevation Profile
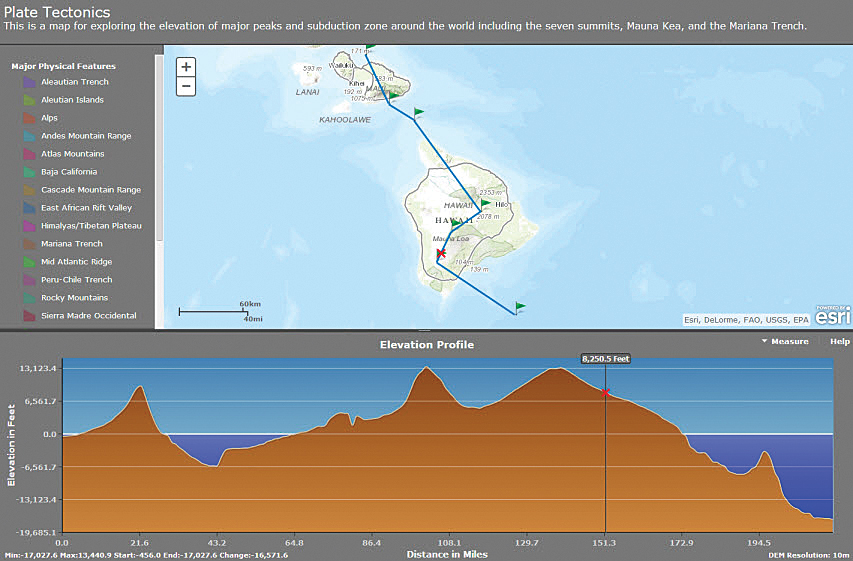
In the first example, an elevation profile is created using the Elevation Profile template. This template, available in the ArcGIS Online web mapping application template gallery, is a configurable web application template that will display the elevation profile for a selected feature or a measured line along with a web map.
To create the web application to generate an elevation profile for the Hawaiian Islands, simply open an ArcGIS Online web map and use the National Geographic basemap. Zoom to the Hawaiian Islands, and then save and share the map with the public or with members of a group. In the Share dialog, choose MAKE WEB APPLICATION. This will invoke the template gallery. Choose the Elevation Profile template.
Templates can be previewed, published, or downloaded to tweak and publish them on a local server. Alternatively, the template can be configured and then published as a hosted application via an ArcGIS Online account.
After selecting the Elevation Profile template, the Hawaiian Islands web map will display. Click the measure icon, then draw a line across the map and finish it with a double mouse click. The elevation profile for the path will be returned and displayed in the panel below the map.
Notice that ocean bathymetry is also included in the global elevation service, so ocean area profiles can be derived. The Elevation Profile template can be used with any publicly shared map.
Visibility Analysis
There are two ways to look at a viewshed. A viewshed is an area that is visible from a given location based on elevation values. A viewshed can also be the area from where the location can be seen.
Either way, determining a viewshed can be important in determining the value of real estate, the location of telecommunications towers, or the placement of military forces.
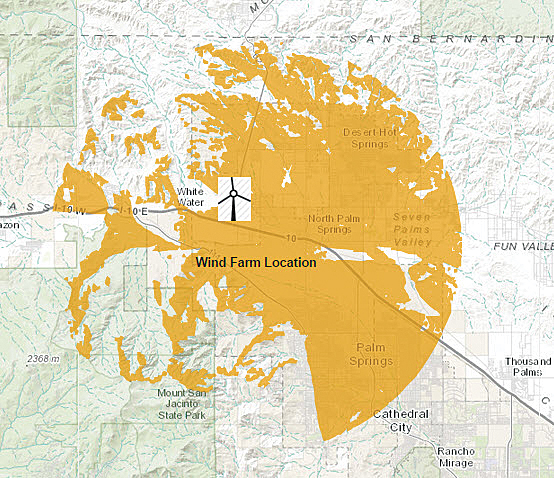
In illustrated example, viewshed analysis was used to demonstrate the visual impact of a proposed wind farm. This analysis determined the areas where the wind farm would be visible. A form of renewable energy, wind energy is perceived as being environmentally friendly, but wind farms can be seen for miles and can be unappealing to neighbors.
Start with a web map in ArcGIS Online that shows the proposed wind farm location as a feature layer, click the arrow to the right of the feature layer name and select Perform Analysis. Use the Create Viewshed tool on the Perform Analysis menu to identify the areas from which the wind farm can be seen. This tool allows the height of the observation point to be included in the analysis. Also, areas greater than a specific distance can be excluded, and in this case, areas more than 9 miles away from the wind farm location were excluded.
The output from this viewshed analysis shows areas from which the wind farm will be visible. This result can be enhanced by using the Enrich Layer tool, also available in ArcGIS Online, which will provide detailed demographic information about these affected areas.
Performing Watershed Analysis
A watershed is the area of land that drains rainwater or snow into one location such as a stream, lake, or wetland. Watersheds can provide drinking water and thus are an important part of an ecosystem. If the watersheds are polluted, drinking water will likely be contaminated.
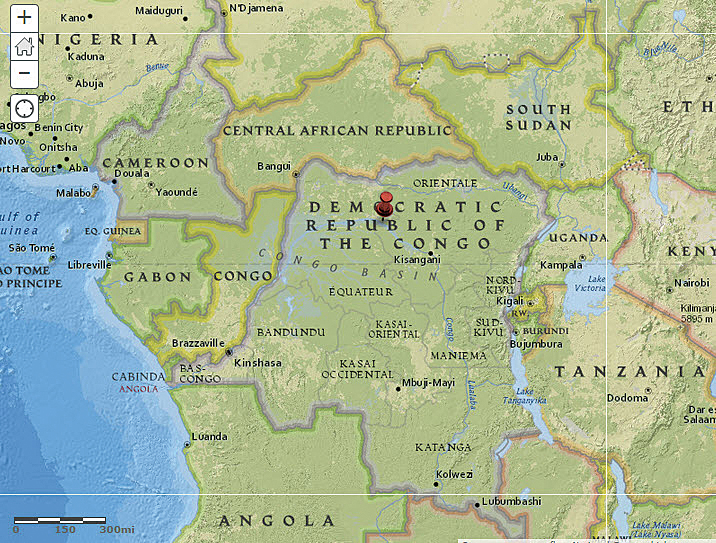
In the example illustrated, the Create Watersheds tool included with the ArcGIS Online Hydrology Services, was used to delineate watershed areas that drain into a given stream section in Africa.
The starting point was an ArcGIS Online web map that uses the National Geographic basemap. After zooming to the Republic of Congo in Africa, a base location on the Congo River was placed as a Map Notes layer. This base location was used to identify catchment areas or watersheds. After right-clicking the Map Notes layer and choosing the Perform Analysis menu, the Create Watersheds tool was selected. The default settings were accepted and Run Analysis selected. The result displayed the delineated watershed area.
Ready-To-Use Services
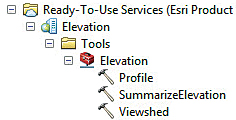
The prevous examples show how to access the Elevation and Hydrology Services using an ArcGIS Online web map. In ArcGIS for Desktop, these analysis services are also easily accessible as Ready-To-Use Services. Ready-To-Use Services give direct access to ArcGIS Online analysis services such as Network Analysis Services as well as elevation and hydrology services.
Access them by simply logging in to an ArcGIS Online organizational account from ArcGIS for Desktop. At the bottom of the Catalog window, expand Ready-To-Use Services, click the Elevation connection, and then the Tools folder, and Elevation toolbox. From the tools displayed, double-click a tool to open it, and run it just like any other geoprocessing tool. These tools can be used directly in ModelBuilder models and Python scripts just like any other tool.
Develop Web Apps Using Elevation Layers
In addition to using the Elevation and Hydrology Analysis Services directly in an ArcGIS Online web map or in ArcGIS for Desktop, developers can use the available REST API to embed these analysis services in customized web applications. Additional information for developers and samples can be found at Esri’s developer website.

Data Sources
The elevation and hydrologic data included with ArcGIS Online Elevation and Hydrology Analysis Services are maintained, hosted, and updated by Esri. This data comes from a number of authoritative sources and grows through the Community Maps Program. As new areas and better resolutions are made available, they will be included in these analytical services.
Elevation data for these services come from the US Geological Survey (USGS), US National Geospatial-Intelligence Agency (NGA), the US National Aeronautics and Space Administration (NASA), and other authoritative sources. The data is furnished in a spherical coordinate system with units of arc seconds. To translate arc seconds, commonly used metric approximations for data from these sources are listed.
- 10-meter (1/3 arc-second) resolution elevation raster for the continental United States from the USGS National Elevation Dataset.
- 30-meter (1 arc-second) resolution elevation raster for the continental United States, Canada, and Mexico from the USGS National Elevation Dataset.
- 90-meter (3 arc-seconds) resolution elevation raster for the land surface of the world between 60 degrees north and 56 degrees south from the Shuttle Radar Topography Mission (SRTM).
- 1,000-meter (30 arc-seconds) resolution elevation raster for the world from the General Bathymetric Chart of the Oceans (GEBCO).
The hydrology services in the United States are based on the NHDPlus Version 2.1 database, which Esri has preprocessed and optimized for analysis performance as web services.
NHDPlus V2.1 was produced by the Environmental Protection Agency’s Office of Water in partnership with the USGS and released in 2013. The NHDPlus V2.1 data is considered the most authoritative hydrologic dataset for the United States.
For the rest of the world, the data is based on HydroSHEDS data, which is high-resolution elevation data obtained from NASA’s SRTM.
Summary
ArcGIS Online Elevation and Hydrology Analysis Services, part of the Esri Living Atlas of the World, can be used within the ArcGIS platform using an ArcGIS Online web map, in ArcGIS for Desktop, or in other web clients through the use of the REST API.
Before these services were available, users had to gather and prepare elevation data, and then find the right analytical tools to perform the analysis tasks. With the ArcGIS Online Elevation and Hydrology Analysis Services, performing common analytical tasks on elevation and hydrologic data is quick and easy and eliminates the need to collect, maintain, or update an authoritative set of base data.
Esri will continue providing hosted analytics against curated data so users can more quickly create results that are more correct than could often be obtained by users on their own. Esri believes this is a pattern that will continue to grow with other data and other analytics.
About the author


