From making maps that have influenced public policy and hung in a fine art museum in New York to pioneering the mapping of transportation systems in Africa to tracking down ghost cities in China, Sarah Williams has applied her knowledge and passion for geography and design to solving problems all over the world.
Williams is currently an assistant professor of Urban Planning at the Massachusetts Institute of Technology (MIT) in the Department of Urban Studies and Planning, where she is also the director of the Civic Data Design Lab. While she is involved in many projects, Williams regularly teaches introductory and graduate-level GIS courses. In her courses, she uses ArcGIS technology and focuses on its analytical and geoprocessing capabilities.
“I emphasize design in all my classes,” said Williams. “I tell my students that ultimately the maps they create will be judged on whether they are readable. If your map highlights the story you want to tell, you will have a greater chance to convey the message contained in the data you used to create it. Good design helps make the map more accessible to the viewer.”
Informing Public Policy from MOMA’s Gallery Walls
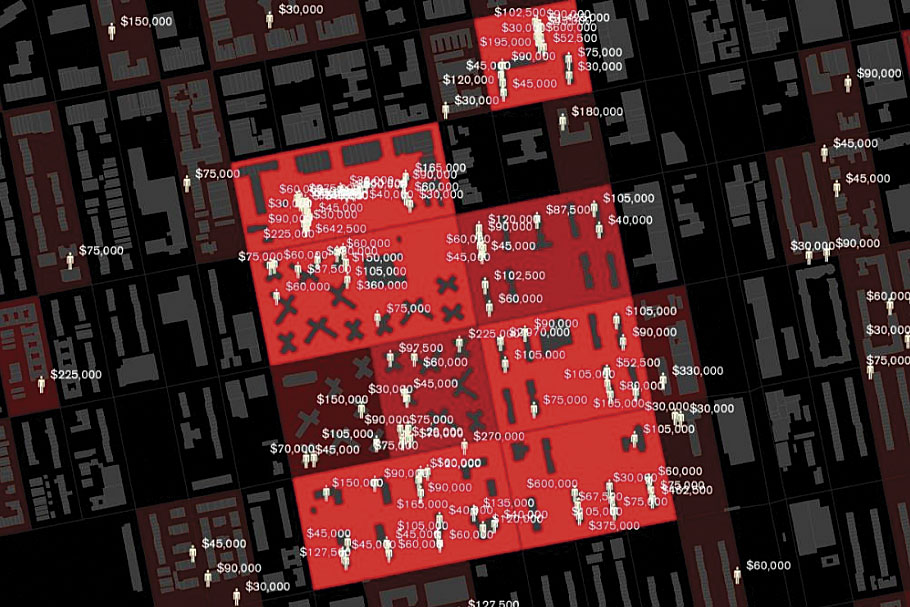
In 2006, Williams joined a team from Columbia University to create Million Dollar Blocks. This design project analyzed spatial information from the urban areas of six cities throughout the United States to determine which neighborhoods had large numbers of residents who have been incarcerated.
The project used Bureau of Justice Statistics data, which included each prisoner’s previous residence and criminal offense and the cumulative cost of incarceration. In addition to Williams, other Million Dollar Blocks team members included Laura Kurgan, Eric Cadora, David Reinfurt, and Leah Meisterlin. The project is a collaboration between the Justice Mapping Center, the Spatial Information Design Lab, and the JFA Institute.
The analysis highlighted (at the city block level) those neighborhoods where former residents had been incarcerated for so long that their prison maintenance costs exceeded one million dollars. The visualizations were created with ArcMap.
“This was the first project that I worked on in which map data visualizations raised public awareness and produced a positive outcome,” said Williams. The maps, in an exhibition called Design and the Elastic Mind at New York’s Museum of Modern Art (MOMA), were seen by policy analysts. This prompted the analysts to use the maps to support the Criminal Justice Reinvestment Act of 2010. The act allocated $25 million for job training programs for released inmates.
“The real strength of these visualizations is that they allow people to examine a social concern in a new way, which can prompt a better understanding of that issue. This is what I call creating a space for public action.”
“On the surface, the Million Dollar Blocks maps, simply show the neighborhoods where prisoners come from. But in fact, they graphically depict a need for after-school programs, drug prevention clinics, and job training courses,” said Williams. “I think that if we could spend $1 million on social programs in these neighborhoods, we could have a lasting impact on them.”
Digital Matatus Keeps Nairobi Residents Moving
Shortly after completing the Million Dollar Blocks project, Williams teamed up with The Earth Institute at Columbia University to develop the first freely available GIS database for transportation and planning for Nairobi, Kenya. The resultant Nairobi Free the Data project helped policy makers, urban planners, and community stakeholders obtain the spatial data they needed to make informed decisions about the future development of the city.
“The datasets we created are available to all, which adds value to them because others can use the data for their own research and planning,” said Williams. The files were ingested into Google Maps and OpenStreetMap.
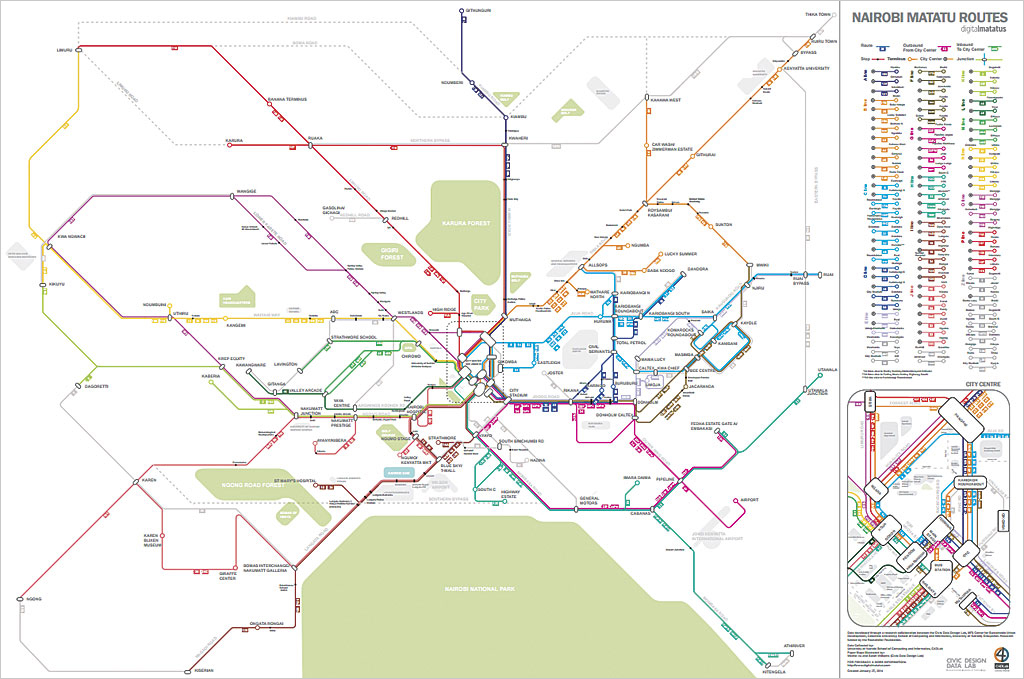
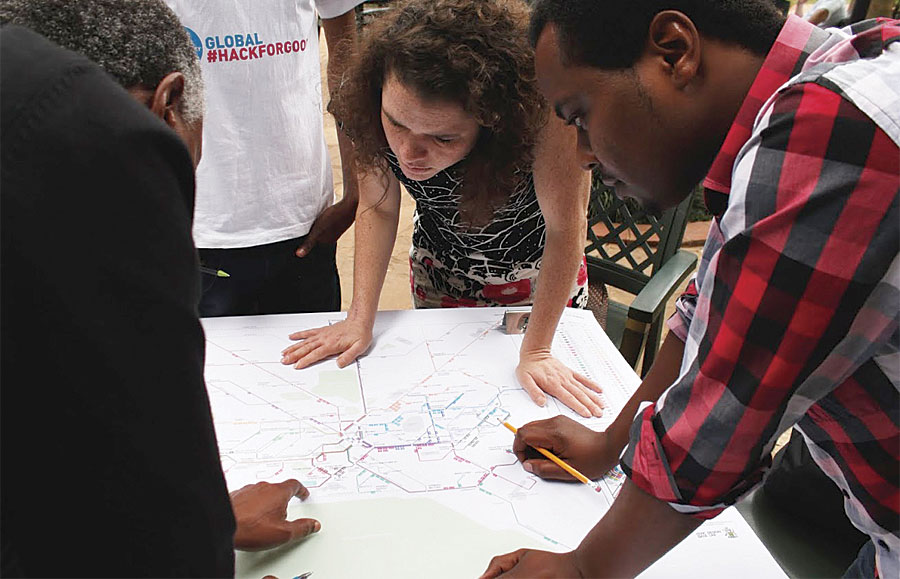
Williams returned to Nairobi in 2013 to begin work on the Digital Matatus project. Matatus, a Swahili colloquialism, is the name of the city’s extensive, semiformal bus system. It means three and refers to the typical cost of a ride (three cents) in the 1960s.
With more than 130 operators that serve hundreds of routes throughout the city, the system is very complicated to document and analyze. Working with the University of Nairobi, Williams developed a cell phone application to capture digital information about routes that was subsequently used for analytical purposes, as well as creating an easily understood, stylized route map for commuters similar in design to subway maps. The methodology developed by Williams has been replicated in other cities that have semiformal bus systems similar to Matatus.
“Semiformal bus systems are the most common form of public transportation in the developing world,” said Williams. “You will find them throughout South America, Asia, Africa, and many other areas. Providing a method to map these transportation systems allows greater mobility for urban dwellers that rely on them.”
The data developed for the Digital Matatus project was accepted for uploading into Google Maps. It was also used for the creation of transit apps by local technology companies so commuters would have bus route information available to them on smartphones.
“Basically, we visually surveyed and plotted the existing routes of the Matatus system and then laid a grid over our plot so we could develop a simplified map that was easy to understand for those using it,” said Williams. “We wanted to show residents how comprehensive the system was and how to use it beyond the one or two routes they regularly traveled. It was also very useful for the operators of the routes because it allowed them to identify both redundancies and gaps in the various lines. They were then able to consolidate some lines, as well as create new ones, and it showed them how they could further develop the system through more considered planning rather than the existing haphazard method.”
The template and workflows developed for the project used open-source tools and methodology with the General Transit Feed System (GTFS) as its standard. The paper map for commuters was created using ArcGIS and Rhino software. The raw data files are distributed in the GTFS and shapefile format. The files have reportedly been downloaded more than 300 times by organizations all over the world for transportation planning and implementation purposes. Williams hopes to create a resource center to further disseminate information on developing GTFS feeds.
Williams worked with the Center for Sustainable Urban Development at Columbia University; the Civic Data Design Lab at MIT; the University of Nairobi’s School of Computing and Informatics; and Groupshot, a design and research firm, to complete the project. The Rockefeller Foundation provided a grant to support this effort.
Looking for Ghost Cities
Currently, Williams is working on a project in China to determine unoccupied residential areas that are often referred to as ghost cities in the popular press. These may be symptomatic of overbuilding in the Chinese real estate market. To find them, Williams needed data about the location of amenities, such as shopping malls, gas stations, restaurants, and hair salons, as well as city populations and transportation networks. Places without these amenities within a certain proximity could indicate that no one lives there.
Unfortunately, the availability of data is often restricted by the Chinese government. Williams’s solution was to use the APIs for Chinese social media sites to scrape data that mentions consumer services. The social media sites used included Sina Weibo (a microblogging site akin to a hybrid of Twitter and Facebook), Dianping (a publisher of consumer reviews) and Baidu (the Chinese version of Google Maps). She analyzed the data from these sites to estimate amenity locations and nearby city populations.
Williams indicates that the accuracy rate in her initial work is 70 percent. She is refining her model to increase its accuracy. The project is sponsored by The Samuel Tak Lee Real Estate Entrepreneurship Lab, housed in the MIT Department of Urban Studies and Planning.
“In this project, we are investigating land use by the interaction of individuals with social media, which allows us to draw conclusions about broader real estate and urban issues in China,” said Williams. “The idea behind the project is to determine risk and opportunity within the Chinese real estate market.”
Looking into the Future
“Eighty percent of all data is privately accumulated and maintained,” concluded Williams. “Often it is automatically collected from our mobile devices. Williams believes that while this data could be very valuable for services such as emergency response or analyzing traffic patterns in real time, it is locked away, for the most part, because of privacy concerns. She sees the need to develop policies and procedures that protect the individual’s personal data rights while allowing public access to this data when it is needed. This might be accomplished by aggregating the data and stripping some personal information from it.
“Consciously or unconsciously, we willingly give social media data away on a daily basis. It’s a matter of how that data is used that becomes the issue,” said Williams. “It would be very beneficial if new data collection and visualization tools were developed that allowed the public to more easily gather data through social media channels and then present it to support community issues. While there seems to be a general belief that the rise of big data is going to change the world, I don’t believe it will happen unless the data is collected and synthesized into tools that can be used for the public good.”
About the author