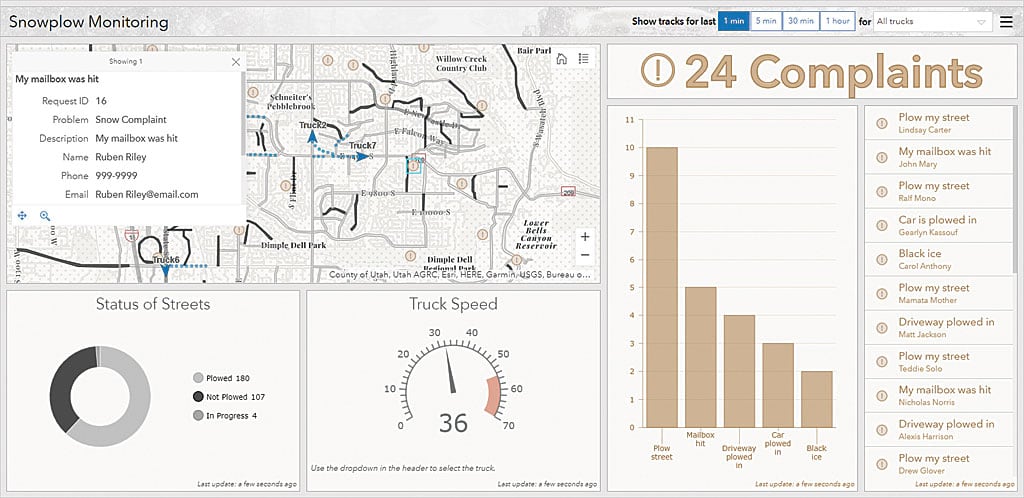
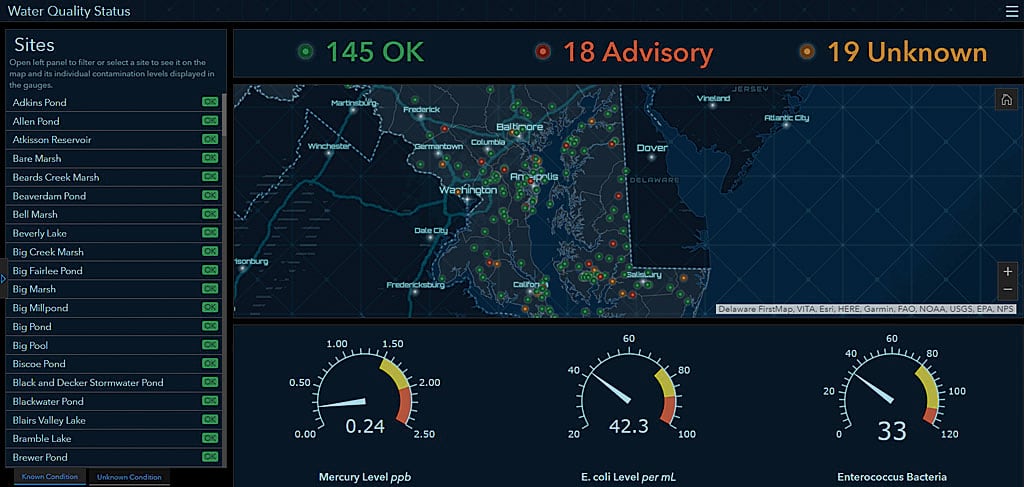
With the release of the next generation Operations Dashboard for ArcGIS, you can now have a comprehensive and engaging real-time view of your data that can be completely authored in a web browser.

Operations Dashboard for ArcGIS brings maps, lists, charts, gauges, indicators, and other elements together in a single web browser window, providing insights for at-a-glance decision-making. Most of these elements are data-driven and can use filtering capabilities to represent the information that fulfills the dashboard’s purpose. The different data visualizations in a dashboard can communicate with each other and update in real time so you can monitor events, people, services, and assets. It turns your data into actionable information.
Dashboards can be operational. They can help your organization monitor what is happening now and respond to changes, incidents, or events. Dashboards can be strategic. These dashboards track key performance indicators and metrics. Dashboards can also be analytical. They can identify data trends or other interesting data characteristics.

Because Operations Dashboard for ArcGIS is fully integrated with ArcGIS Online and/or ArcGIS Enterprise, it can integrate your organization’s data layers and maps. Since dashboards are items within an organization, they can be shared across the organization or with the public so everyone shares a common view. Create a new dashboard from the Map Viewer, Content page, a web map’s item page, or launch Operations Dashboard for ArcGIS from the App Launcher in the header of your ArcGIS site. Add one or more elements, then drag, group, stack, and resize elements. Configure each one to present your data in the most useful way. Use the action framework to control the behavior of elements and build interactions that let users derive key performance indicators using selectors. If you currently use Operation Views created from the legacy Windows-based Operation Dashboard app, they will continue to work and be supported, but consider migrating to the new web-browser based Operations Dashboard app. Operations Dashboard for ArcGIS is included with your ArcGIS Online subscription and with ArcGIS Enterprise 10.6.


