Wish you could sit down with an experienced developer and pick up some productivity tips or learn some of the less well-known capabilities of the ArcGIS API for JavaScript? Well, now you can. This article shares some of the handiest features in the API that you can use right away.
1. Save time with queries
Many apps need to perform queries as part of key workflows. If you’ve built an app with the ArcGIS API for JavaScript, you might be familiar with QueryTask, which allows you to do spatial and attribute queries against services to find features that match your criteria.
There is a less well-known way to do queries that could save you time. Instead of using the traditional approach to create a new query object, create a query right from a feature layer or scene layer by calling the featureLayer.createQuery() or sceneLayer.createQuery().
If you create the query directly on the layer, your queries will be prepopulated with existing definition expressions or other query parameters already set on the layer. You can then modify the query parameters as needed. For example, you can specify a geometry for a spatial query or adjust the where statement.
After you have executed your query, easily zoom to the envelope of the returned features by passing the query results to the goTo method. This works for both 2D (in a MapView) and 3D (in a SceneView).
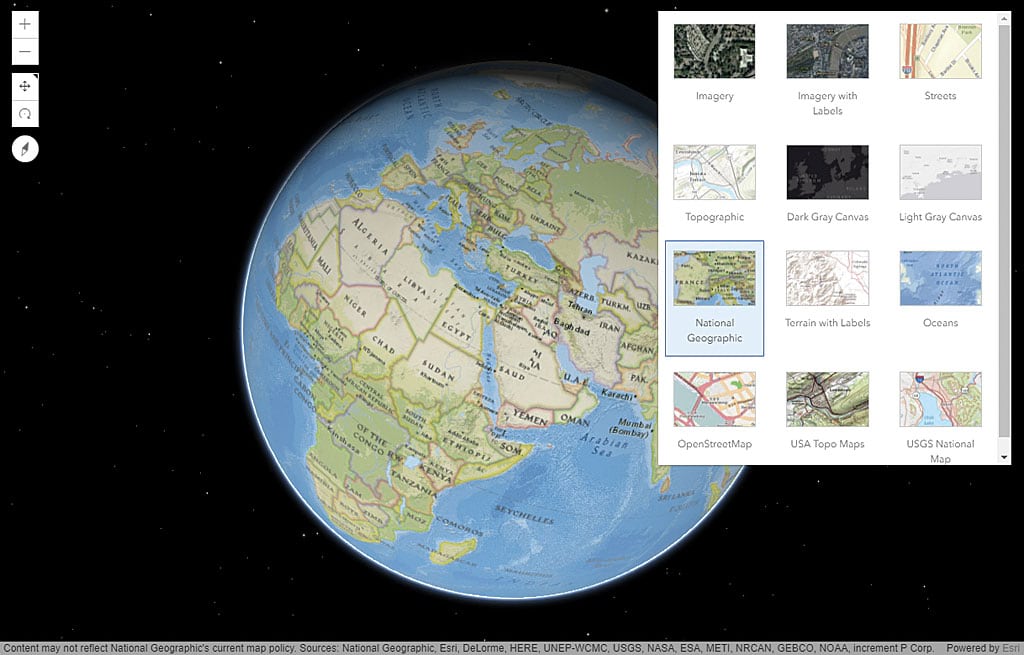
2. What you need to know about picking basemaps
You pick one of Esri’s default basemaps simply by referencing it by name inside your map definition (e.g., basemap: “streets” or basemap: “topo-vector”). Several default basemaps are available in either vector or raster format, and each version has a unique name. For example, the raster version is “topo,” and the vector version is “topo-vector.”
You can also use a basemap that is not an Esri default basemap in your application.
Find any of the basemaps provided by the ArcGIS platform by searching ArcGIS Online. Once you find the desired basemap, reference it by its item ID to load it in your application. The item ID is found in the item URL after “id=”.
Use this form:
new Map({baseMap: {portalItem: {id:"WebMap-id-with-basemap"}}})
You can even update the basemap used by a web map after it is loaded by providing a new portalItem as shown in Listing 1.
webmap.load().then(() => {

webmap.basemap = {

portalItem: {

id: "b74e3eeef31942869c1f611f341ce8ed"

}

;}
Listing 1: Updating the basemap
If you’d like to try this using a fun basemap, search “creative vector tile layers” on www.arcgis.com and browse some of the interesting vector tile basemaps Esri has published.
You can also let the end user pick the basemap. The ArcGIS API for JavaScript gives you a few widgets you can use to allow your end user to dynamically switch between basemaps in your app.
The BasemapGallery widget displays a collection of images representing basemaps from ArcGIS Online, ArcGIS Enterprise, or a custom set of map or image services. If the user is signed in to an ArcGIS Enterprise or ArcGIS Online account, the group of basemaps configured for the organization will automatically populate the BasemapGallery widget. You can also let the user switch between two basemaps using the simple BasemapToggle widget. This widget, like all widgets in ArcGIS API for JavaScript, is responsive and will adapt appropriately to any screen size.
3. Use an expression to dynamically create an attribute for visualization
The ArcGIS API for JavaScript provides powerful ways for you to turn data into information using data-driven visualization. Attributes in a layer can be used to drive the color, opacity, size, or rotation of features. Traditionally, this is done by directly using the attribute values in the layer.
What if those attributes aren’t in the layer? You can now use an Arcade expression to dynamically calculate another field at run time to drive the desired visualization. This dynamic field can be calculated using any information source—including a combination of other attributes in the layer.
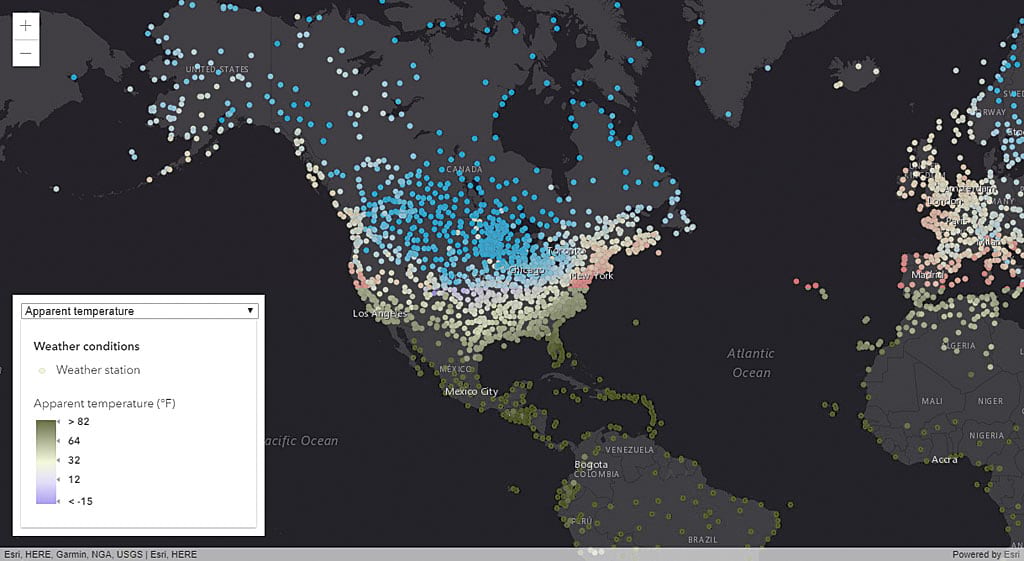
Using Arcade eliminates the need to add new fields to a service layer but yields the same results. For example, to visualize the temperature that people actually perceived rather than the temperature that was measured at weather stations worldwide, wind chill and heat index attributes available in a weather service were used by an Arcade expression to generate the fields used for this visualization of apparent temperature. The expression determined which variable (wind chill or heat index) to use as the apparent temperature.
4. Display the same map with different projections
-
This map of the United States includes three map views in three different spatial references. It uses the dynamic projection of features in a feature layer inside each map view.
With version 4.x of the ArcGIS API for JavaScript, you can display multiple views of the same map using different spatial references. Perhaps you have a primary map of a region that is best displayed with a particular spatial reference, and an inset map showing another region that is best displayed with another spatial reference. Each view uses the same map instance containing a feature layer.
Feature layers are dynamic and include support for projecting features to different spatial references. Note that this ability to reproject on the fly separates the feature layer from other static layers, such as a vector tile layer, that only display data with the spatial reference applied to the data when the vector tile was created.
By default, the view will use the spatial reference of the basemap. If the basemap isn’t specified, then the spatial reference of the first operational layer is used. Explicitly setting the view’s spatial reference to a different coordinate system overrides the spatial reference of the operational layers. You can play with a sample demonstrating this functionality by going to js.arcgis.com, clicking the Sample Code tab, and searching the samples for “composite views.”
5. Switch between web maps in your app and maintain focus
To tell a story, you might want your app to allow the user to switch between web maps in the app to show different datasets or alternative visualizations. You can either maintain the center, scale, and rotation of the map view when the user switches between the web maps or allow all web maps to be initialized independently using the properties originally saved in each web map.
If you want a smooth experience when showing different datasets or visualizations of the same location without changing the map’s focus, maintain the center, scale, and rotation between web maps. If the web maps have data appropriate for different extents or scales, you’ll probably want to use the properties saved with the web map. With either approach, the first step is to create a WebMap object for each web map you want to display by referencing the web map ID.
To maintain the center, scale, and rotation between web maps, assign the web map you want to be displayed to a single instance of the map view.
To use the properties saved with the web map, create a new map view object for each web map and display the currently selected view.
To play with this functionality, go to js.arcgis.com, click the Sample Code tab, and search for “swap web maps.”
Read the ArcGIS Blog regularly for current and helpful information. Just search for “javascript” to locate posts on the ArcGIS API 4.x for JavaScript. Also check out the ArcGIS API for JavaScript developer site at js.arcgis.com, which contains a wealth of samples, an API reference, and guide topics to help you.
Happy coding!