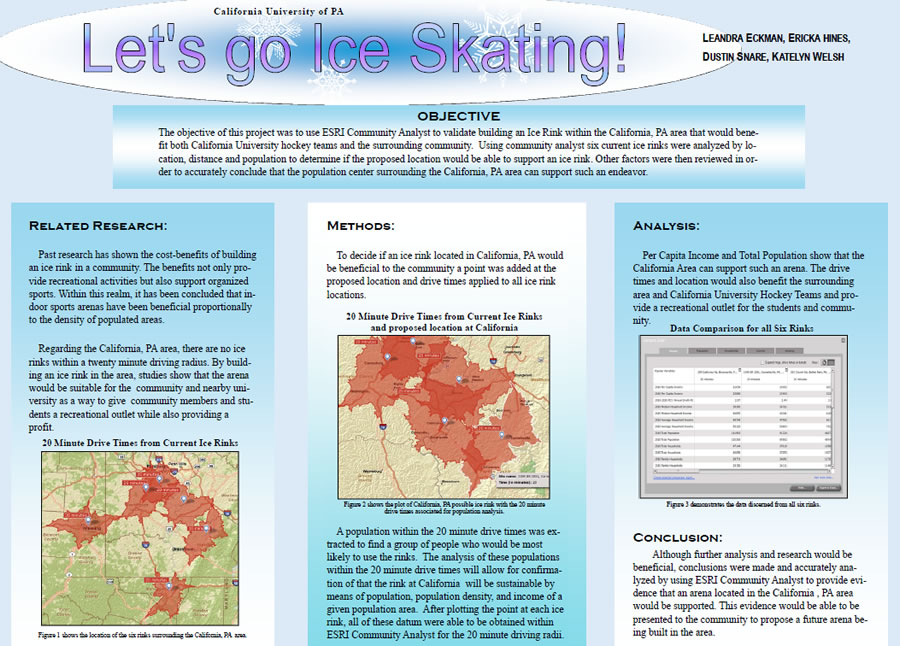
For a class project, a group of California University of Pennsylvania (CAL U) wanted to find out if there would be enough likely users to support opening of an arena for hockey games and ice skating in the small town of California, Pennsylvania.
Their professor, Thomas Mueller suggested they use Esri Community Analyst software to help them with their demographic, income, and drive-time analyses.
“Community Analyst is pretty intuitive, which allows my students to easily grasp the concepts of spatial analysis,” says Mueller, a professor of geography at California University of Pennsylvania (CAL U) near Pittsburgh. “In addition, because the application can be applied to a broad range of topics, I let them choose projects that are important to them so that they find the class personally engaging.”

Community Analyst is a cloud-based web application that’s easy to use and lets people view and analyze demographic, economic, business, health, and education data to better understand a particular city or town.
Students Leandra Eckman, Ericka Hines, Dustin Snare, and Katelyn Welsh worked on the Let’s Go Skating project, using the software to analyze six existing skating rinks in the area by location, distance, and population to determine if a new rink would be viable. The team determined that there were no ice rinks within a 20-minute driving radius of the town. Using per capita income and total population data, team members concluded that there was a sufficient population living within that radius to ensure the success of a new ice skating rink that the university hockey team and local residents could share.
Having taught upper-division GIS courses in the university’s Department for Earth Sciences for the past 14 years, Mueller understands the power of GIS to examine trends and patterns that are not always obvious.
To introduce GIS concepts in other classes, Mueller decided to use Esri’s Community Analyst software in his introductory Demographic Analysis course, which is targeted at freshmen and sophomores. They generally have no previous knowledge of GIS before taking this class, but Mueller is able to quickly catch his students’ attention when he demonstrates how easy the software is to use for simple analyses and how it can be applied to local community issues.
In the past, students in Mueller’s Demographic Analysis class created population density maps using data from the US Census Bureau. The class has been able to explore several different local issues with Community Analyst and its extensive datasets, including demographic and spending patterns and transportation data. These include the benefits of opening an under-21 club in the community and validating the decision to allow Walmart to open a local Supercenter.
“Projects of this nature are very engaging for students because they can work in teams to solve problems on a topic of particular interest to them,” Mueller says. “I think there is great potential for the use of Community Analyst in university courses in government, science, and even the arts.”
Mueller said that the class projects have made his students more aware of campus and community issues. He intends to implement a community service component in the class to make it more relevant to the community and potentially improve the quality of life in the area.
From an academic point of view, Mueller believes that Community Analyst provides a good introduction to GIS capabilities because it teaches students how to use spatial data for analytical purposes, as well as how maps can better illustrate information. “Both of these factors are important in developing geospatial awareness,” he says.
Mueller thinks GIS will have a bright future at CAL U. “I have used GIS in several of my classes including Crime Mapping, Disaster Vulnerability, Emergency Management, and Environmental Applications of GIS,” he says. “My students have generally found that the use of GIS allows them to include greater analysis in their research, as well as making it more engaging. I think that as more students and faculty better understand the capabilities of GIS, it will be included in more courses. Some of my students in Demographic Analysis indicate that they plan to use Community Analyst in other classes, including Tourism Studies. So, as students and faculty continue to explore the use of GIS, I’m sure it will be used in other classes and departments on campus.”
