
Whether you use Esri’s Ocean Basemap as an online reference map or as a basemap for your own maritime projects, this beautifully designed cached map service renders a richly detailed topography of the ocean floor. You can view bathymetric data, such as depth values in meters, and features, such as trenches, sea ridges, and seamounts. Notable features mapped include Challenger Deep, the deepest known area of the ocean floor, which film director James Cameron visited in March 2012 aboard the deep-sea submersible Deepsea Challenger.
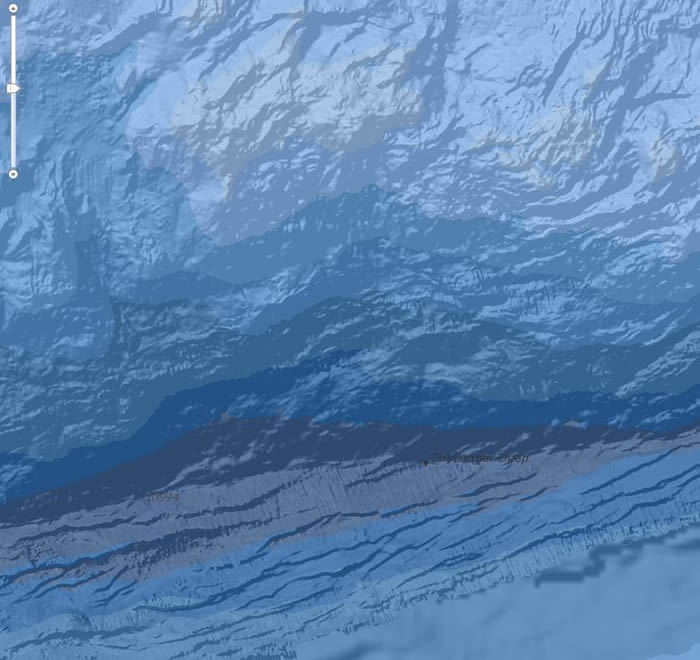
The bathymetry data displayed above comes courtesy of the University of New Hampshire.
But the Ocean Basemap goes beyond being just an exploratory tool that displays subsurface features, water bodies, and depth values. Data can be overlaid on it to perform a spatially based analysis of an almost limitless variety of data, whether posted on ArcGIS Online or maintained by you or your organization.
This tip walks you through how to visually analyze data overlaid on the Ocean Basemap. For this scenario, you will use both pipeline and fishing restriction data for the Gulf of Mexico to help you answer two simple questions: How can commercial fishing and the oil and gas pipelines coexist there? And how can the captain of a commercial fishing boat avoid oil and gas pipelines so as not to endanger the crew or vessel or badly damage a cable or pipeline by snagging it with ropes, nets, or anchors? Such an event could be expensive and dangerous to the boat, the crew, and the equipment that belongs to another business (the owner of the pipe or cable). The accident might affect the regional economy if damage to the industrial equipment necessitated a stoppage for repairs, and if a spill occurred, there might be environmental damage.
Step 1: Log in to ArcGIS Online at ArcGIS.com using either your organization’s ArcGIS Online subscription or a personal account.
Step 2: Create a new map by clicking the Map button on the toolbar.

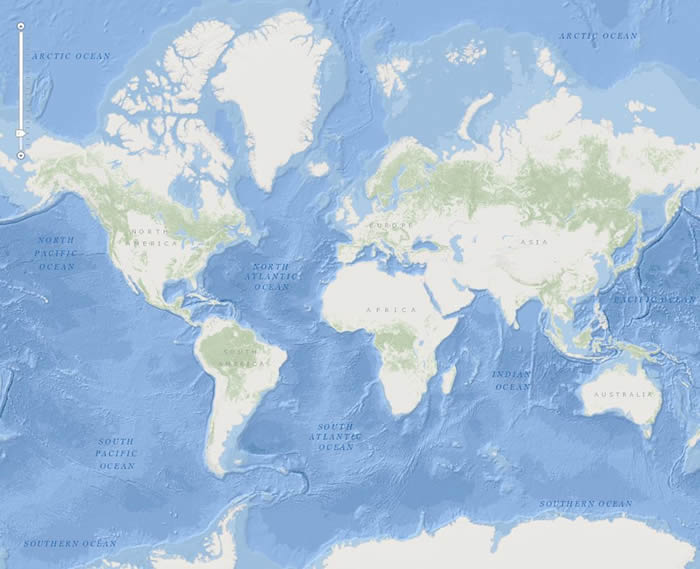
Step 3: To add the Ocean Basemap, click the Basemap button. A number of basemaps will appear in the gallery. Select Oceans.

You’ve just created a web map with the Ocean Basemap as a canvas to work on, as seen here.
Step 4: Find pipelines data using ArcGIS Online to see the locations of the natural gas and oil pipeline distribution network.
Click the Add button and select Search for Layers from the drop-down list. Search ArcGIS Online by typing in pipelines by product. Click Go.
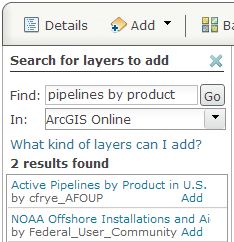
The results will include Active Pipelines by Product in U.S. Waters. Click Add to place the data in the web map.
Your web map should look like the live one below.
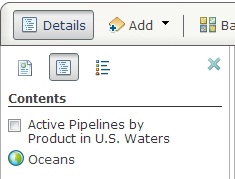
For now, turn the pipelines off in your view. Click Details and then click Contents and uncheck the check box next to the pipelines layer.
Step 5: Find fishing restrictions data.
Search ArcGIS Online for data related to fishing restrictions in US waters. Again, click Add and choose Search for Layers. This time, type in the search term fishing restrictions, click Go, and select U.S. Fishery Management Plans.
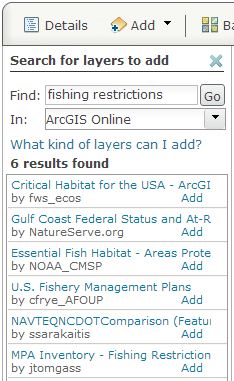
Click Add to place the data in the web map.
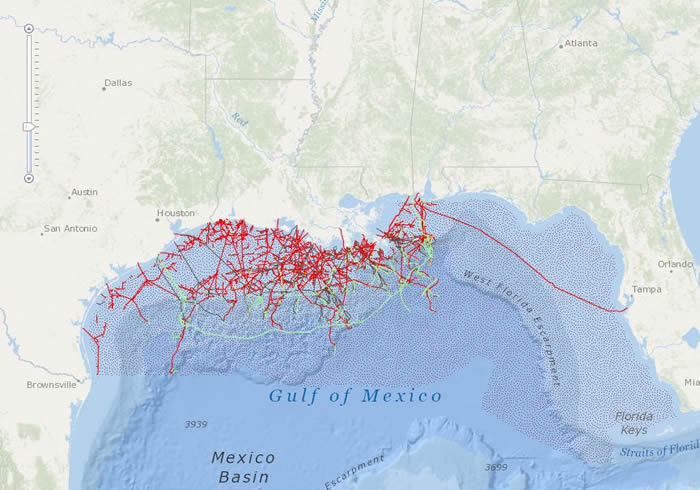
Your web map should look like the live one below.
Step 6: Return to the toolbar and click Details and Contents again. Check the Active Pipelines by Product in U.S. Waters check box, which turns the pipelines layer back on. Click the arrow that appears when you hover over U.S. Fishery Management Plans. Then click Move Down to put the fishery management area polygons below the pipeline line features, enhancing the web map’s clarity. This is what you should see:
Step 7: Zoom in a bit closer to the area just south of New Orleans, Louisiana, and take a look at what’s going on in that area.
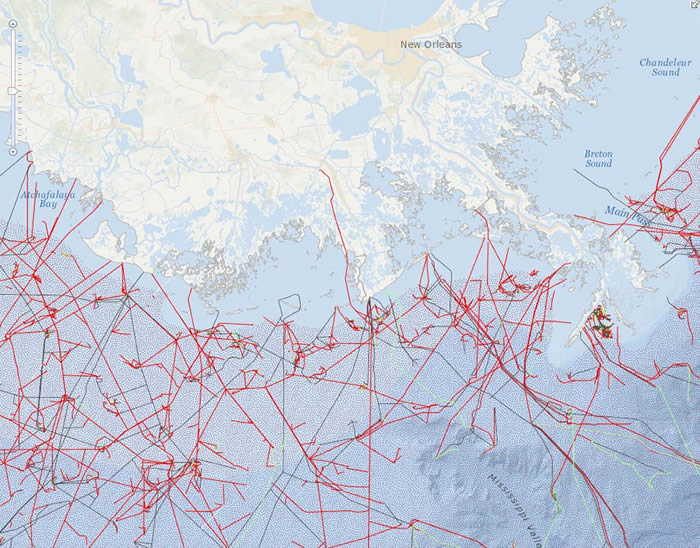
Step 8: Click Legend (to the right of Contents), and you will see a high proportion of natural gas lines (red) and oil lines (black), with some service lines (green) in this area. This area is overlapped by the dot-shaded pattern of the fishery management dataset. Go ahead and click a few of the pipelines, and notice the attributes displayed in the pop-up window. You can see the pipeline’s owner, the product the pipeline carries, where it originates, the product’s destination, and more.
But remember the questions posed for the scenario. What if a fishing boat’s equipment happened to hook a pipe in this area? Click away from any pipeline but still in the dot-shaded pattern of the fishery management dataset. In the pop-up window that appears, notice what’s contained in the popup window. You can see the site name, plan name, and links to the fishery management plan URL and the full Code of Federal Regulations entry. The site name for this area is Gulf EEZ – Bottom Trawl Weak Link Requirement.
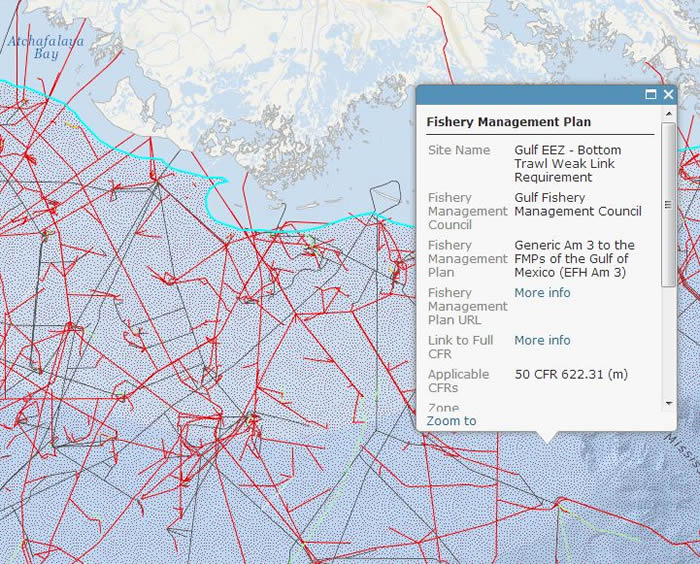
Commercial fishing in this area requires the trawling equipment to contain a weak link. If a trawled net happened to touch a pipeline or cable, it would by design break the net equipment away from the boat pulling it before it could damage the pipe or cable. You can investigate the URLs in the attribution to determine the particular strength requirements.
So the simple questions have simple answers, and you were able to find them in a quick and engaging way using the Ocean Basemap coupled with ArcGIS Online. You can do even more complex and sophisticated analyses using any one of Esri’s basemaps and ArcGIS Online. To learn more about the wide variety of data sources and broad scope of analysis functionality available with ArcGIS Online, read this tutorial.