GIS helped a seventh grade class in Canada better understand both the benefits and drawbacks of the proposed Northern Gateway Pipeline (NGP), an oil and gas infrastructure project in western Canada.
The proposal to build twin pipelines that would run between the provinces of Alberta and British Columbia draws support from some people because of economic benefits. Others oppose it for environmental reasons.
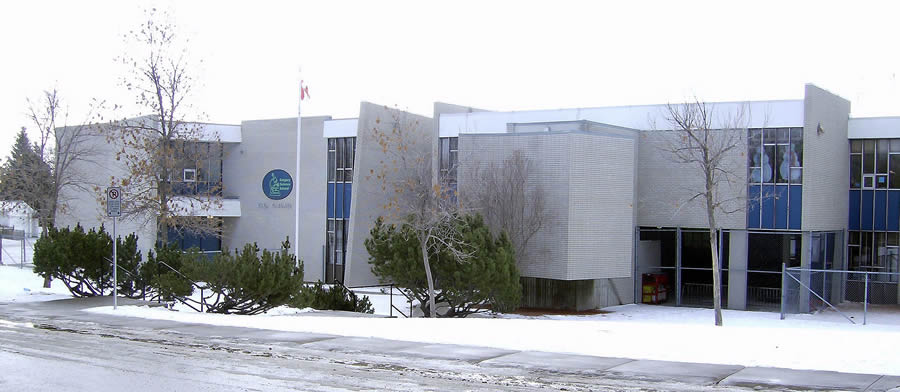
Greg Neil, a teacher at Connect Charter School in Calgary, Alberta, wanted to help his seventh grade science class develop informed opinions about the project. The students used Esri’s ArcGIS Online as a mapping, research, design, and information management tool to study the project so they could then decide whether or not to approve of the pipeline’s construction.
“GIS helped my students understand and visualize [the proposed route of] the Northern Gateway Pipeline and the ecological regions it will affect,” Neil said. “ArcGIS Online was a powerful tool to help my students understand what questions they needed to ask before conducting their research because, in the end, it was their research that informed their opinions.”
In 2014, the innovative class project won a City of Calgary Mayor’s Environmental Expo award. And 30 students, in a post-project survey, unanimously agreed that ArcGIS Online was a useful learning tool.

A Comprehensive Look at the Pipeline
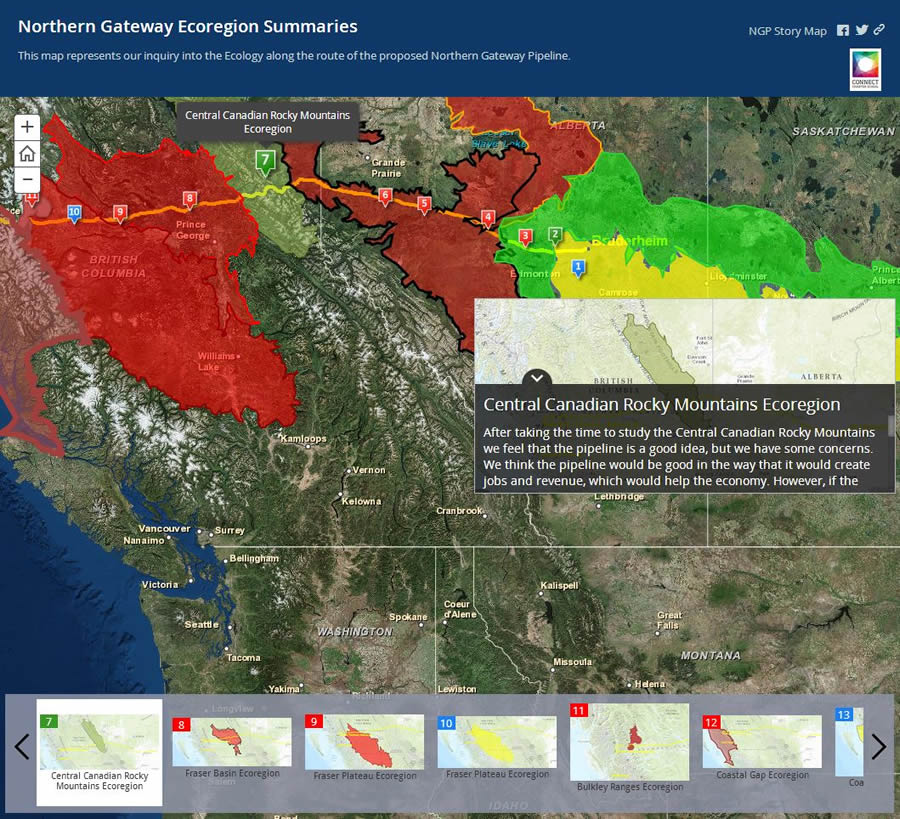
Neil asked his class to take the lead role in a comprehensive study of the NGP, which would transport oil and natural gas condensate along a 1,177-kilometer route between Bruderheim, Alberta, and Kitimat, British Columbia.
Students formulated their own questions, mapping the planned pipeline route, and researched the potential environmental and social impacts. They also learned about mapping and spatial analysis and how to evaluate the impacts of infrastructure development.
Before starting the class project, Neil looked for technology that would give his students the tools to visualize and map the NGP and the land that would be impacted by its pipelines. This technology also needed to give the students the ability to organize information and present their project findings in a visually meaningful way. Mindful of the school’s mission to integrate innovative technology with instruction, Neil also wanted students to use their laptops, which the school provides. Other requirements included minimal financial investment and student training in the technology.
Neil applied for and received Esri Canada’s GIS in Education Grant on behalf of the school in 2013. The grant, which is awarded to five Canadian schools each year, provides both desktop and online ArcGIS software and services for all computers in a school, as well as maintenance for two years and education resources.
With no previous formal training using ArcGIS Online, Neil contacted Esri Canada’s Education and Research group, took advantage of its readily available training resources, and integrated the platform’s features into his lesson plan.
Students Map the Pipeline
After formulating questions about the NGP to frame their research, Neil’s students worked in groups to learn how to plot the pipeline’s proposed route using ArcGIS Online. The students worked independently to delineate their own study areas, selecting 50-kilometer sections with 5-kilometer buffers using the buffer tool in ArcGIS Online. Each student was responsible for studying the potential social and environmental impacts of the NGP within their study area.

“It really depended a lot on the specific regions they researched and the impacts the pipeline might have in those regions,” Neil said. “The students studying the coastal areas were most opposed due to potential tanker spills, while students focused on largely agricultural lands in Alberta saw little reason to be against it when the lands were already disturbed. Some students were against the project for reasons related to climate change, but many supported the pipeline because of anticipated economic benefits.”
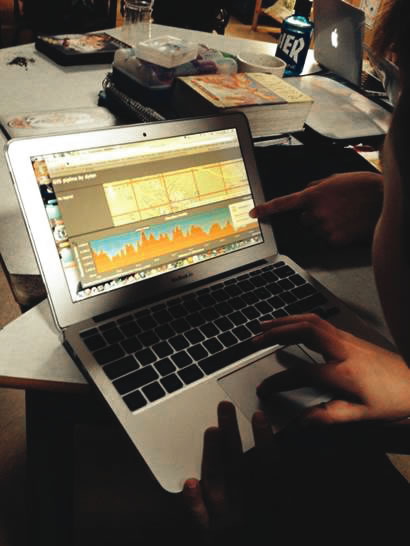
As part of Esri Canada’s GIS in Education Grant, Connect Charter School was given a school-wide subscription to ArcGIS Online at no cost. Each student received an individual login to the school’s subscription to create, save, and share maps using personal laptops. Since ArcGIS Online is a hosted solution in Esri’s secure cloud, installing software on each student’s machine was not necessary. That eliminated the need to use the school’s IT department and infrastructure.
For their research, students used ArcGIS Online as a data source and for browsing and selecting layers of preconfigured data to enrich their maps with information. Since the project was so successful, Neil hopes to help the school expand the use of ArcGIS Online to other subjects.
Neil said his class has continued to use ArcGIS this year to study topics related to physical geography, geology, and ecology. For one task, students used ArcGIS to explore a variety of concepts related to earthquakes, including drawing correlations among epicenters, earthquake magnitude, and plate boundaries along the west coast of Canada.
“We are currently using ArcGIS to explore and discover how the natural resources in Canada are developed in different ecological regions,” Neil said. “This work forms part of a massive simulation we are undertaking, where students are faced with the challenge of balancing the resource-based economies in their assigned regions with the goal of creating and maintaining a sustainable future.”
Watch this video to learn more about how the seventh graders from Connect Charter School used ArcGIS to study the Northern Gateway Pipeline. For more information, contact Greg Neil. Follow him on Twitter, @CGEDNeil.
