Fall 2004
Fall 2004 |
|||||||
|
|
|||||||
Amongst the Icebergs, GIS Innovation Aids Antarctic Research |
|||||||||
|
By Kevin Mackay, National Institute of Water and Atmospheric Research, New Zealand In 1904, Captain Robert Falcon Scott and the crew of Discovery left the Ross Sea at the end of Scott's first expedition to Antarctica. Despite the onset of scurvy and malnutrition, as well as the loss of all their dogs, Scott and his team had reached 82�17'S—the furthest south any expedition had yet gone.
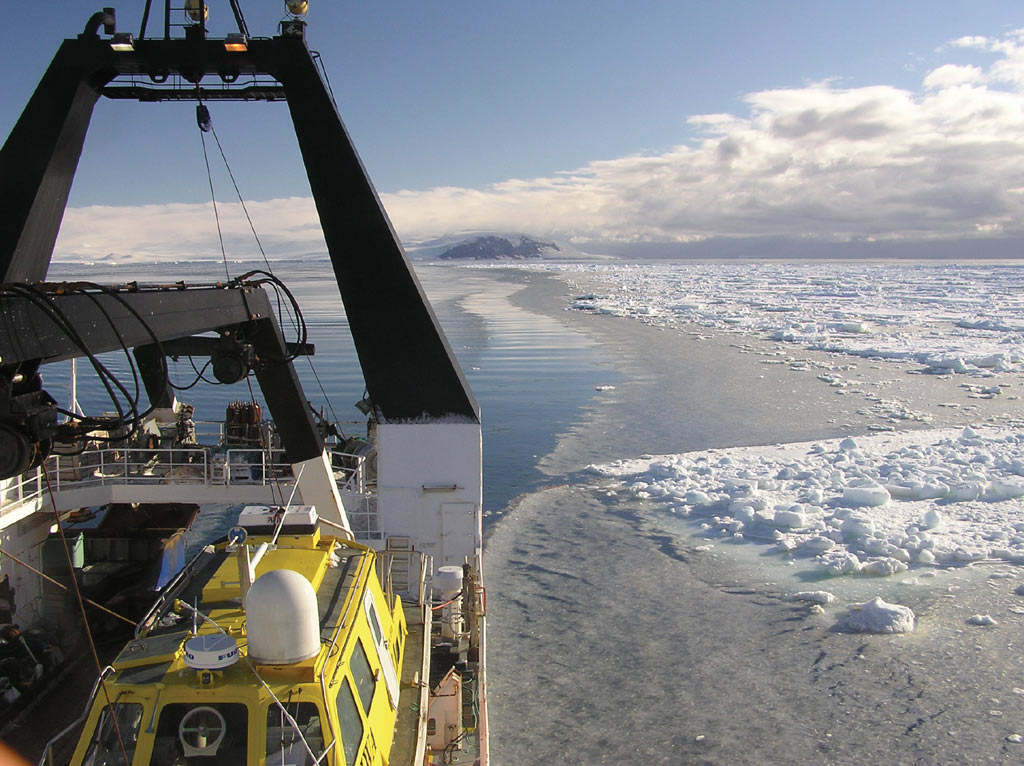
A hundred years later, the hurricane force winds and high seas that confronted a New Zealand-led international research team in the Ross Sea seemed little hardship in comparison. The Ross Sea 2004 voyage of discovery was undertaken by New Zealand's National Institute of Water & Atmospheric Research (NIWA) from January to March 2004. It was jointly funded by the New Zealand Ministry of Fisheries and Land Information New Zealand (a department responsible for official land and seabed information). The voyage undertook a biodiversity study, in cooperation with the Italian Antarctic Research Programme, and continued hydrographic survey work in the northwestern Ross Sea. It was the fifth Antarctic expedition for NIWA's 70-meter deepwater research vessel Tangaroa.
The biodiversity researchers wanted to describe and quantify the diversity of bottom-dwelling invertebrates and fish. They wanted to understand how different environmental factors affect the structure of these marine communities. Ultimately, this information will help scientists predict the likely impact of changes in ice conditions resulting from climate change or human activities. Much of the study area had not been surveyed in detail before. The scientists needed to
NIWA used ArcGIS Desktop (ArcInfo) with the ArcGIS Spatial Analyst and ArcGIS 3D Analyst with ArcScene extensions to enable people with no specialist GIS training or experience to produce extremely high-resolution images of the seafloor within minutes of surveying.
Tangaroa uses a Simrad EM 300 multibeam echo sounder to produce the equivalent of an aerial photograph of the seafloor. The EM 300 is mounted on the ship's hull and works by transmitting (pinging) "beams" of sound to the seafloor and measuring the time it takes for the signals to return. This time is directly related to water depth. With 135 beams fanning out across the seabed for each ping, up to 4.5 km of seabed can be mapped in a single pass. Once the multibeam data has been "cleaned" to remove marks made by shoals of fish and the like, the multibeam operator onboard Tangaroa uses a special menu designed by NIWA using ARC Macro Language (AML), which means that no experience in ArcInfo Workstation is needed to produce the GIS images. The operator simply starts ArcInfo and types a command to launch the menu. The operator can browse directories, choose a file to process, adjust the settings, and then click "run" to produce whatever view is required. The team had planned to map all depth ranges over an entire survey area before collecting samples, but the voyage encountered two storms. The team spent seven and one-half days attempting to take shelter from winds gusting up to 95 knots and swells approaching 12 meters. With time, money, and safety at stake, the scientists opted to map a single depth range, take samples immediately, and then do more mapping. As soon as each survey line was completed, the multibeam data was processed and maps of the survey area were produced within minutes, thereby minimizing vessel downtime before sampling operations could begin.
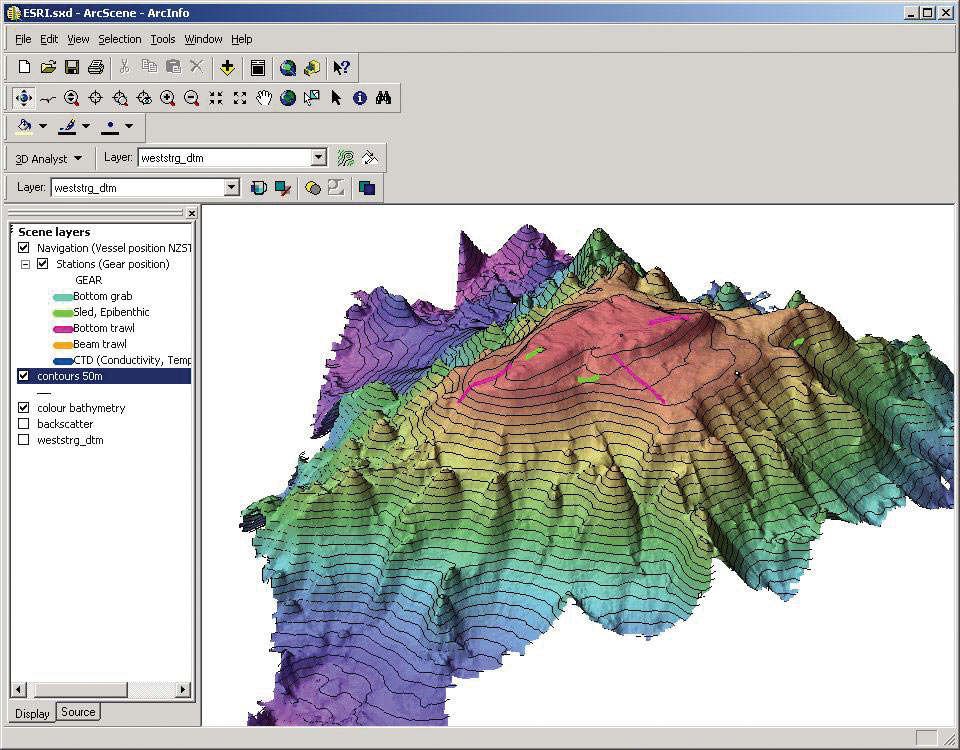
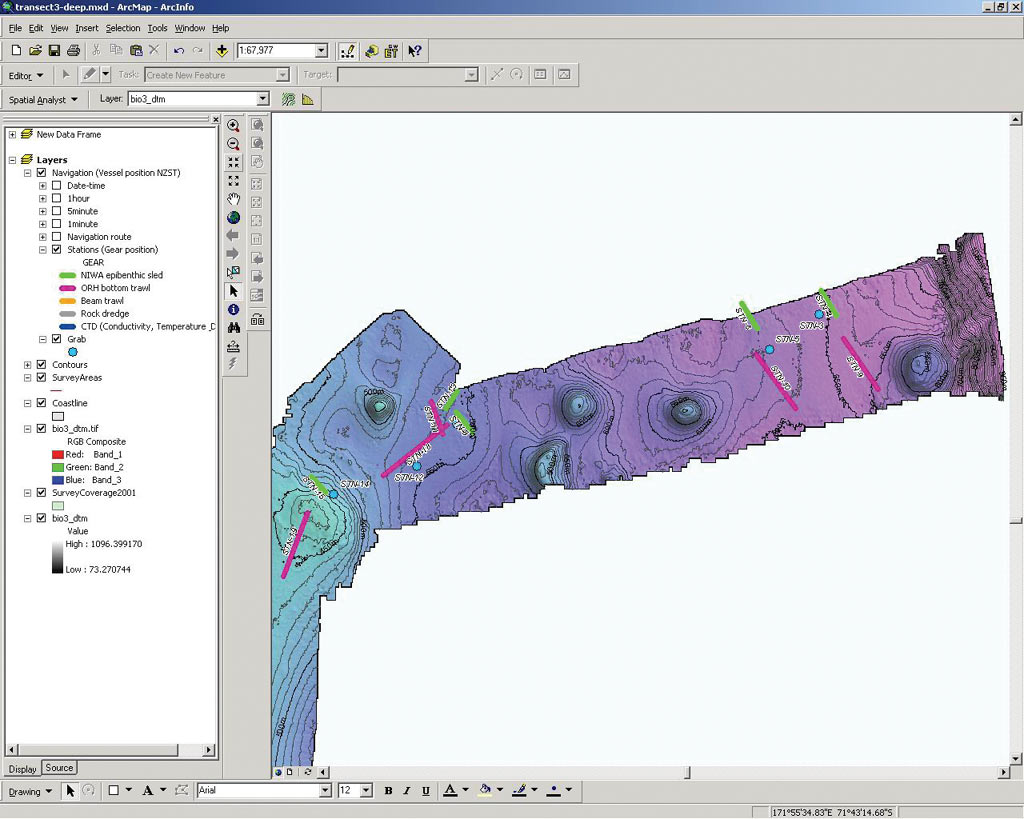
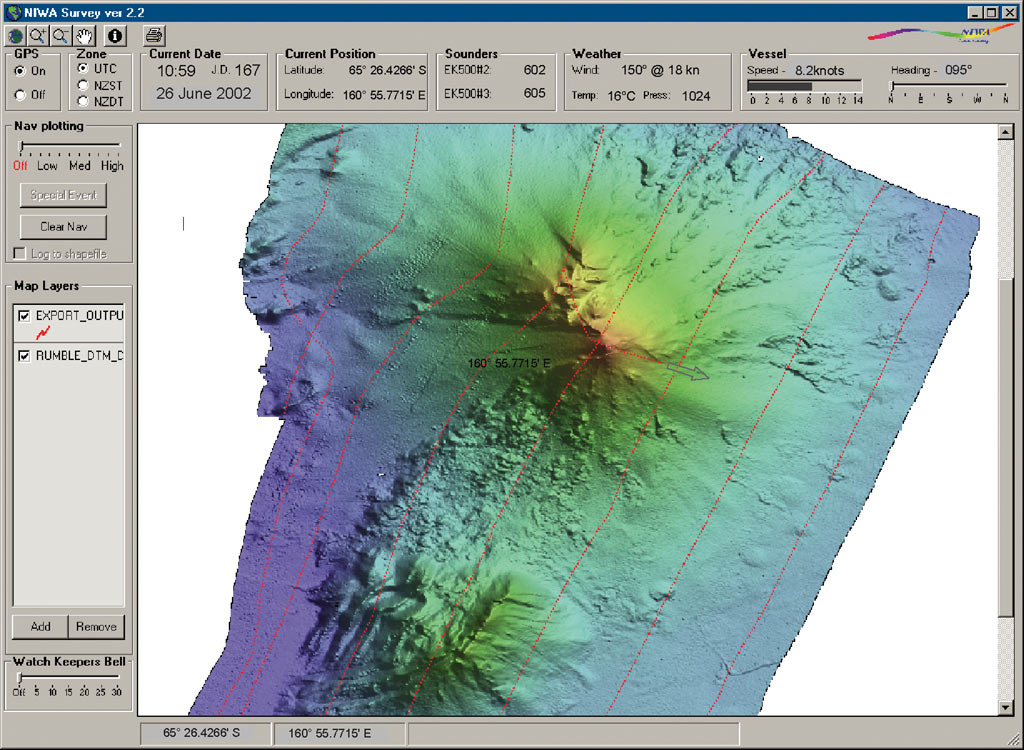
When mapping the seafloor with a multibeam echo sounder, the strength (or amplitude) of the returned signal depends on the nature of the seabed. Thus it is possible to assess what the substrate is made of (mud, sand, gravel, bedrock, or a mixture of these) and how rough or lumpy the seafloor is. A standard template was created in ArcGIS to produce charts of any area of interest so the scientists could accurately plan the deployment of sampling gear in the right depth and in a suitable seabed type. The ArcGIS Spatial Analyst extension allows scientists to analyze the slope and aspect of the seabed to aid their decision making. ArcGIS 3D Analyst with ArcScene was used to help scientists visualize the topography and inspect the study area at any angle, from any direction, and with varying vertical exaggerations. NIWA software developers also wrote an application called NIWA Survey that provides a real-time view of the vessel's position. This application incorporates georeferenced TIFF images and shapefiles generated from the multibeam processing and overlays the position of the vessel as a tracking layer. The scientists were able to monitor Tangaroa's position from any of the laboratories onboard, giving the sampling equipment the best chance of reaching its desired target. The benefits of using ArcGIS Desktop in planning biodiversity sampling in the Antarctic were many. It reduces the number of misdrops and aborted gear deployments and hence increased the amount of sampling that can be done within the survey period, as well as limits environmental damage. Despite the storms, the survey achieved its main objectives. NIWA and its international collaborators now face several years of work to fully define the diversity of fish and invertebrates found on the survey. For more information, contact Kevin Mackay, NIWA ocean geology (tel.: 64-4-386-0479, e-mail: k.mackay@niwa.co.nz), or visit www.rosssea2004.govt.nz and www.niwa.co.nz. |