Fall 2004
Fall 2004 |
|||||||
|
|
|||||||
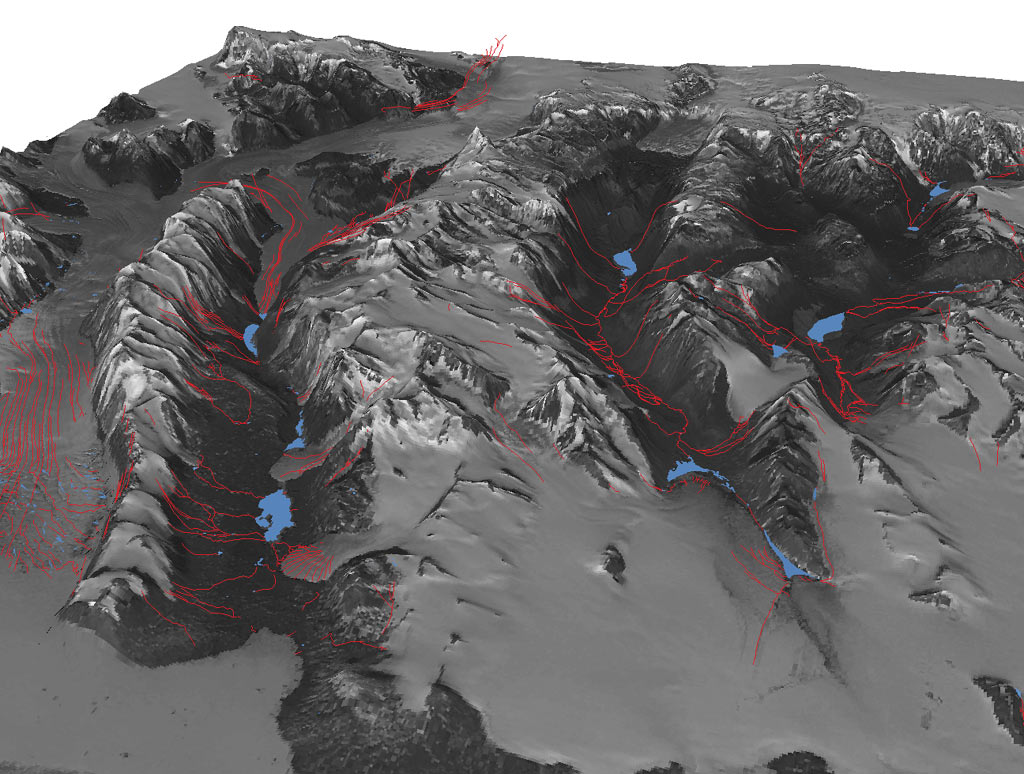
Scientific Research Uses GIS in the McMurdo Dry Valleys, Antarctica |
|||
|
By Michael Prentice, University of New Hampshire
Many scientists, primarily from the United States and New Zealand, work on a wide variety of research projects in the McMurdo Dry Valleys (MDV), South Victoria Land, Antarctica. Covering 8,000 square kilometers, MDV is the largest ice-free area on Antarctica. How Antarctica formed, the role of Antarctica in global climate change, and the biologic processes necessary to sustain life in a polar desert are a few of the scientific questions being addressed. The scientists, as well as science program administrators and science support personnel, all need the capability to search for and use digital, highly resolved geospatial information describing the physical features of MDV. Additionally, because the location of sampling points is vital to sharing scientific data, the MDV science community needs a geospatial technology to manage and facilitate access to the data. A few specific examples follow.
To address this need, a University of New Hampshire (UNH) team led by this author produced the first GIS of the major physical features of MDV. This effort was made possible by funding from NSF and collaboration with the U.S. Geological Survey (USGS) and the New Zealand Institute of Geological and Nuclear Sciences (NZ IGNS). The GIS has two major components. The first is landscape framework data. This includes a network of geographic control points, a satellite image basemap for use in mapping at a scale of 1:50,000 and aerial photographic basemaps for mapping restricted areas at a scale of 1:10,000. The second component is information describing the major physical features of MDV, principally bedrock geology, surficial geology and geomorphology, soils, glaciers, lakes, and streams. Both geospatial and tabular information for these features have been captured. A time dimension was added because MDV hydrologic features changed in size over the last few decades because of climate change. The GIS project, referred to as VALMAP (for Valleys in Antarctica: Layered Mapping, Analysis, and Planning), involved numerous scientists from the United States and New Zealand. They chose ArcGIS Desktop (ArcInfo) as the GIS software because of its many features and wide usage both in the United States and New Zealand. They also used Esri Business Partner Leica Geosystems GIS & Mapping's ERDAS IMAGINE software for imagery processing. The work was accomplished on both UNIX and PC machines. Framework DataVALMAP digitally captured the metadata for geographic control points (GCPs) collected previously in MDV by USGS and Land Information New Zealand. A USGS/VALMAP team also went into the field to collect new GCPs, as well as photographs of existing GCPs. A GCP point theme was produced as was extensive metadata, including imagery of the GCPs. Three SPOT images were rectified in ERDAS IMAGINE using these GCPs and served as the satellite image basemap for VALMAP. Aerial photographic coverage of MDV is extensive (more than 20,000 frames) and dates to the late 1940s. VALMAP produced an arc theme that inventories all 250 flight lines and provides metadata. ArcInfo software's ARC Macro Language (AML) was used to produce point coverages of the center points of the individual frames. Michael Routhier, GIS scientist at UNH's Institute for the Study of Earth, Oceans, and Space, notes, "The power of GIS gives researchers easy access to invaluable resources that were previously difficult to access with conventional mapping methods." Because detailed mapping was an important goal of VALMAP and aerial photography provided the only high-resolution imagery available at low cost, VALMAP personnel determined that some photographs should be rectified. "ERDAS IMAGINE provided us with a low-cost solution for producing quality high-resolution images for mapping," explains GIS scientist Stanley Glidden, also at UNH's Institute for the Study of Earth, Oceans, and Space. Additional framework elements added to the VALMAP GIS by using ArcInfo geoprocessing tools were separate surface topographies for glaciers, unconsolidated sediment, and bedrock. The 50 m surface contours that were provided to VALMAP from the USGS 1977 topographic maps of MDV, as well as contours from miscellaneous topographic maps digitized by VALMAP, were the starting point. VALMAP added contours from point estimates of depth to glacier base, depth to lake bottom, and depth to bedrock from a variety of scientific studies. Prentice explains, "The dimensions for ice, lake, and sediment bodies today are fundamental to validating geophysical models that simulate past fluctuations in these systems. Despite meager data density, getting these data sets into the GIS is important for raising community awareness." Thematic DataThematic layers on major physical features were provided by experts in their respective fields. Bedrock geologic information over much of MDV was provided by Mike Isaac, Ian Turnbull, and Dave Herron, of NZ IGNS, from the quadrangle maps published by that agency. The locations of more than 500 soil pits in MDV were reconstructed by the original investigators, Jim Bockheim, professor at the University of Wisconsin; Iain Campbell of Land and Soil Consulting NZ; and Graham Claridge, NZ IGNS, using points marked on aerial photographs that were also identifiable on VALMAP image basemaps. The value of the extensive morphological, physical, chemical, and climatic data from these pits was increased dramatically once the pits were geolocated. The distribution, character, and laboratory data describing unconsolidated MDV sediments, both at and below surface, was provided by a UNH team using the literature and original data. ArcInfo permitted VALMAP to improve consistency and agreement between the different data sets that share boundaries. Additionally, explains James Gaynor, UNH graduate student in the Department of Earth Sciences, "GIS, especially ArcGIS Desktop and its ArcMap application, strongly facilitated on-screen mapping of glacial deposits given the ability to interpret and edit multiple layers and tabular data simultaneously using various color, shading, and transparency options. This saved time because it cut out the step of producing hand drawn map sheets." Thematic layers were also produced for the dynamic elements of the MDV landscape, including glaciers, semipermanent snowbanks, lakes, and streams. Some themes were produced for different years using the aerial photographs for change detection. Trevor Chinn, New Zealand National Institute of Water and Atmospheric Research, provided point data detailing the seasonal budget of snow accumulation and ice ablation on selected MDV alpine glaciers between 1972 and 1984. The sum of these terms gives the mass balance of the glaciers, which indicates whether they are growing or shrinking. Anna Krusic, UNH Earth Sciences graduate student, used ArcInfo to integrate point mass balance data with the surface topography to determine mass balance over glacier surface elevation zones and total glacier mass balance. The VALMAP GIS has been used and significantly extended by MDV Long-Term Ecological Research project members. VALMAP GIS components are being made available using ArcIMS 9 at the USGS Atlas for Antarctic Research Web site (usarc.usgs.gov/antarctic_atlas) and at www.valmap.unh.edu. For more information concerning VALMAP, contact Dr. Michael Prentice, research associate professor, University of New Hampshire (tel.: 603-862-4783, e-mail: mike.prentice@unh.edu). |