Fall 2006
Fall 2006 |
|||||||
|
|
|||||||
Esri's 2006/2011 U.S. Demographic Data Tracks Population Changes |
|||||||||||||||||||||||||||||||||||||||||||||||||||||||||||
Populations usually move when area conditions change, improve, or decline. This is particularly true during catastrophic events such as the mass out-migrations that occurred in the Gulf Coast region during the 2005 hurricane season. Economic and social changes tend to occur gradually, which facilitates demographic data forecasting. Most forecasts are predicated on measurable trends and preclude sudden, catastrophic change. Forecasts of dramatic change are not popular. Forecasts of catastrophic change are even less popular—even if the change could be projected from known conditions. None of the July 2005 forecasts could include the catastrophic effects of Hurricanes Katrina, Rita, and Wilma on Florida and the Gulf Coast communities in Alabama, Mississippi, Louisiana, and Texas. Esri's 2006/2011 demographic data updates reveal population movements resulting from trends and catastrophic events based on newly revised models, data sources, and methodologies. Current events, such as rising inflation or interest rates, and regional distinctions, such as the availability of jobs or affordable housing, affect the social and economic trends that are captured in Esri's 2006 demographic updates. The housing market remains central in the discussion of current trends. After the last recession, housing construction was one of the few growth sectors in the economy. An unprecedented increase in home values combined with low interest rates, innovative financing, and government incentives heated the housing market to historic rates. Economic trends were subsidized by demographic trends that included the maturing of Generation Y members into their household formation stage and the investment of the baby boom generation in purchases of second homes and retirement planning via real estate.
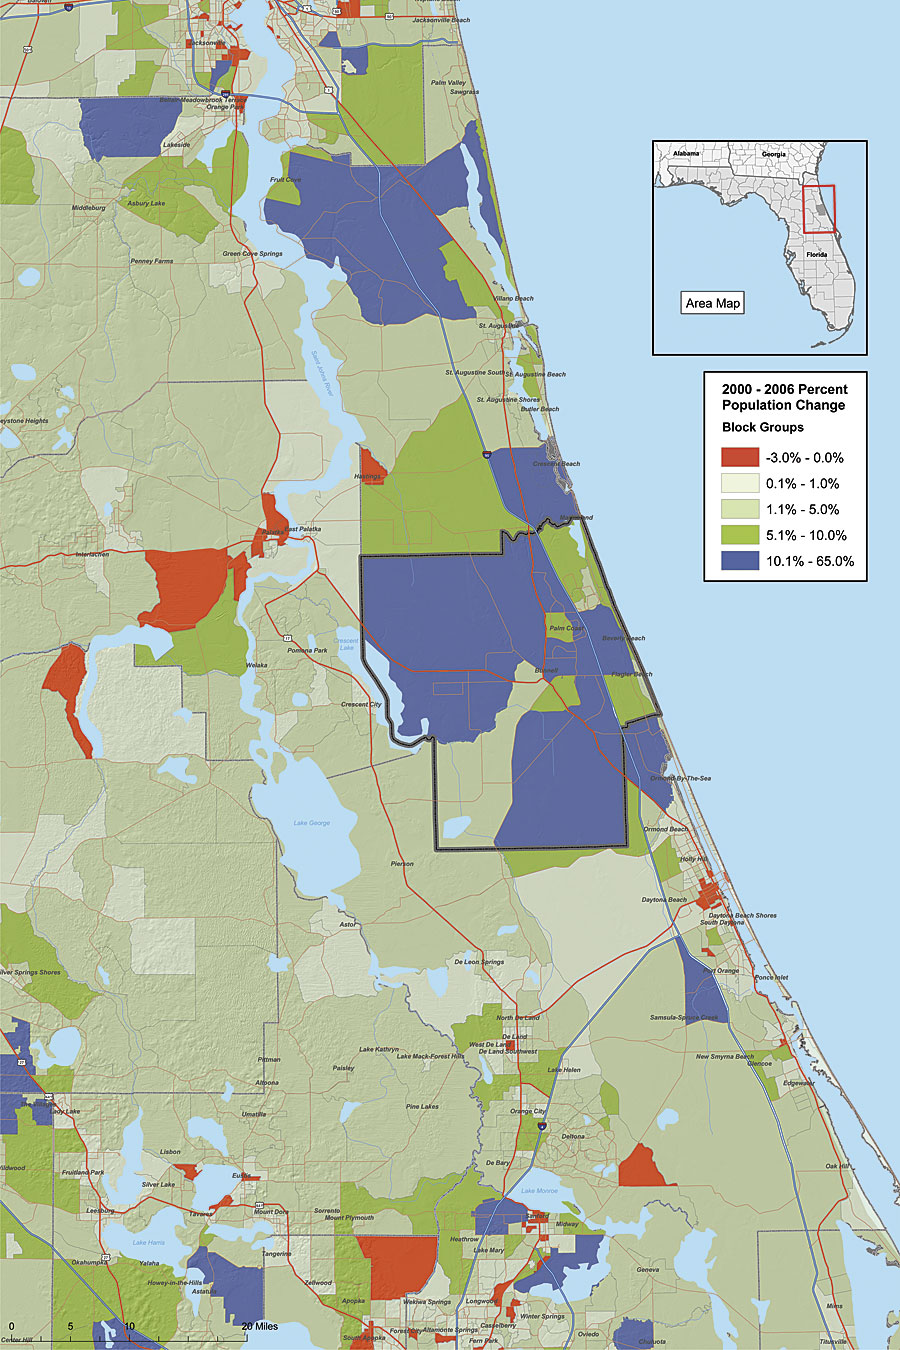
The quest for affordable housing continues to attract population growth in suburban counties of thriving metropolitan areas. The fastest-growing counties through 2006 represent suburban sprawl: Flagler County, Florida; Loudoun County, Virginia (Washington, D.C., metropolitan area); Rockwall County, Texas (Dallas metropolitan area); Douglas County, Colorado (Denver metropolitan area); Scott and Sherburne counties, Minnesota (Minneapolis-St. Paul metropolitan area); Placer County, California (Sacramento metropolitan area); and several counties in the Atlanta, Georgia, metropolitan area. Sustained population growth also increases the appreciation of homes in the most popular counties. For example, home value in Flagler County, Florida, increased by 1.8 percent annually from 1990 through 2000, while population growth averaged 5.7 percent annually. Today, the median home value is more than $273,000 and growing by more than 15 percent annually. However, double-digit growth is localized in select areas. The table below strikingly illustrates extreme population changes in some U.S. counties due to trends and catastrophic change. Population increases are a result of the search for affordable housing in outer suburbs of thriving metropolitan areas; the most striking population declines occurred in the Gulf Coast region after the 2005 hurricanes. More InformationFor more information about Esri's 2006/2011 demographic data updates, trends, geographic changes, and methodologies, visit www.esri.com/communitydata.
|