Fall 2007
Fall 2007 |
|||||||
|
|
|||||||
GIS Mapping Technology Delivers Record-Time Assistance to Commuters
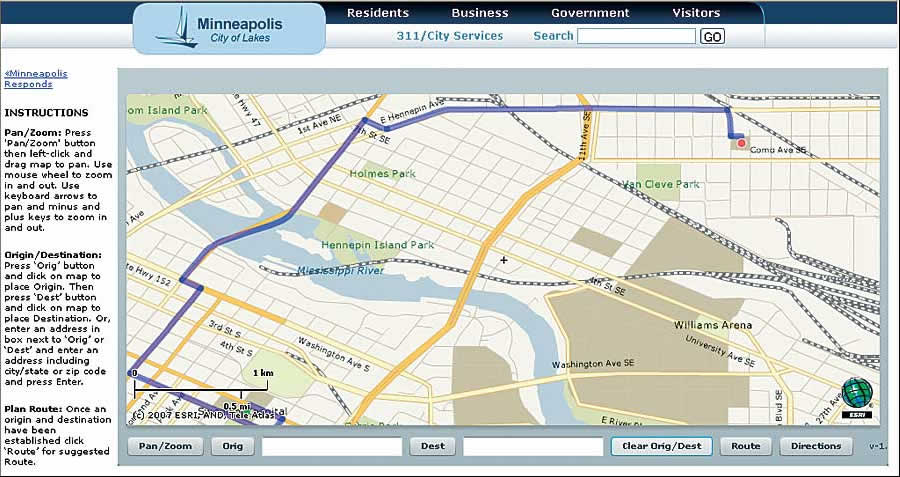
Rerouting Application Helps Minneapolis Cope with Bridge Disaster |
|||
Highlights
The bridge that spanned the mighty Mississippi River in Minneapolis, Minnesota, shook violently. The concrete roadway exploded as expansion joints compressed and the pressure buckled the tension bridge. Crashing into the water, the bridge took 13 lives with it and left the city in turmoil. Passersby looked up 60 feet to see a tractor-trailer burst into flames and cars precariously perched and crushed by signs. Miraculously, a school bus stopped just short of plunging over the edge and the children on board suffered only cuts and bruises. But Interstate I-35W, the city's main artery, had been severed.
Following the disastrous Minneapolis bridge collapse on Wednesday, August 1, 2007, at 6:00 p.m., the city was ensnared as travelers attempted to reroute to get to their destinations across the Mississippi River. Overnight, traffic barriers were set up to accommodate rescue operations, closing major streets and blocking travelers' passage. City managers needed an immediate solution to the problem of getting people to work and keeping businesses open. The city's Information Office uses Esri software as its GIS platform, with its computer dispatch system for emergency responders already fully integrated. The day following the disaster, Minneapolis city officials contacted the local Esri office to request an online GIS-based routing application by which citizens could see where the current city-defined barriers were located and then create a personal route map to get them where they needed to go. Minneapolis' chief information officer Lynn Willenbring describes the situation, "When the I-35W bridge collapsed, in addition to needing to support all the emergency responders and doing the rescue and recovery efforts, it was critical that we get information out to everybody who lives or works in Minneapolis. People needed to know how to get around and circumnavigate this major artery that was no longer available for getting in and out of the city. We needed a Web application where citizens could easily see what routes were open and quickly create personalized from/to routes that could direct them from their home addresses to specified destinations within the Greater Twin Cities area. "The solution we wanted needed to incorporate attributes that were not available in consumer Internet mapping applications, such as Map Quest or Yahoo! Maps or Google Maps," explains Willenbring. "This solution needed to include specific up-to-date city information about what streets were recently closed to traffic, what streets were primary detour routes, and what streets were going to have expedited traffic flow. The application needed to incorporate all of that data into a knowledgeable routing system for citizens to use." Using the ArcWeb Services Flex API, staff from Esri quickly put together a two-tiered Web application that consists of a public-facing Web page and an administrative Web page. The administrative page allowed the city administrators to define barrier locations, which changed from day to day because of disaster command post needs. For example, a street that is closed in the morning may be reopened in the afternoon and another street closed, so a commuter's route to work may be very different than the route back home. The city posts this dynamic data immediately on its Web site. The public-facing Web page (www.ci.minneapolis.mn.us/traffic/routeplannerintro.asp) is open to commuters who can see the most recent barrier updates and create personalized routes by either entering an address or clicking start and end points. A route is instantly calculated and drawn, so the commuter can print out the route and take it on the road. Says Willenbring: "By the time the true commuting started in the days following the bridge collapse, citizens were able to quickly understand the best route for them to take over and above what was provided at the state level by the Minnesota Department of Transportation (MnDOT), because obviously MnDOT did not know what we were going to be doing to the downtown streets and to some of the alternate routes." The ArcWeb Services-based application was set up as a managed service, which meant the application's database, including street and barrier data, was hosted by Esri. This made one less worry for the city. Minneapolis city managers were assured that the application was running and the data was current 24 hours a day, seven days a week. A major reason for the fast turnaround rate is that the Flex API handles all the cross- platform compatibility issues. Developers do not have to spend time building code for each supported browser type, such as Microsoft's Internet Explorer or Mozilla's Firefox. Additionally, the fastest way to deploy applications with the API is for developers to use a version of XML, called Macromedia XML (MXML), to complete a variety of tasks and functions. For example, to create a simple map application with pan and zoom capabilities takes approximately five lines of code. The creation and deployment process of the two applications was fast. The accident occurred on Wednesday, and early the next morning the city called Esri with its request. By Thursday noon, the database had been put together and the middleware designed. It was tested, passed through staging, checked and rechecked, and deployed on the production servers. By Friday morning, the administrative application was built that lets city data administrators define values on the map and click on a particular location on the map and create barriers. By noon, a barrier editor tool was devised that allowed users to type in an address or an intersection and input the barrier data to update the middleware information. Testing was finished at four o'clock, and by five o'clock the application was ready to be pushed to production. Minneapolis staff deployed it on the city's Web site, and during the weekend, the application was tweaked. By Monday morning, the Minneapolis community was putting the Web site to work creating personalized routes. A great deal of work needs to be done before commuters will have a new bridge. Two months following the disaster, National Transportation Safety Board inspectors continued to go over every inch of the collapsed structure to exactly determine the cause of the collapse and understand the course of events. Willenbring predicts that it will be at least a year before the city completes the cleanup of tons and tons of concrete and metal. MnDOT has already proposed a bridge plan for new construction that includes a light-rail-ready bridge, but the completion of any plan will take a long time. In the meantime, the city of approximately 373,000 citizens continues to be open for business, and every day, commuters turn to the routing application to help them find their way around the rubble while the city gets back on its feet. More InformationFor more information, please visit www.ci.minneapolis.mn.us/traffic/routeplannerintro.asp, or contact Frank Baxter, Esri (e-mail: fbaxter@esri.com). |