ArcNews Online
Fall 2010
[an error occurred while processing this directive]Chesapeake Bay Restoration Made Transparent to Public
Program Builds Web-Based Accountability Tool
Highlights
- GIS makes the ChesapeakeStat database user-friendly so that the public can visualize data geographically.
- The database includes management activities for conservation and restoration.
- GIS shows people what agencies are doing and how they are spending money.
![]() More than 10,000 years ago, melting glacier ice caused the Atlantic Ocean's sea level to rise and form the largest estuary in North America. The Algonquin Indians who lived in the once pristine regions of the watershed called the bay Chesepiooc, meaning "Great Shellfish Bay." Today, we know it as Chesapeake Bay. An estimated 2,700 species of plants and animals, including 200 species of fish, live in the estuary.
More than 10,000 years ago, melting glacier ice caused the Atlantic Ocean's sea level to rise and form the largest estuary in North America. The Algonquin Indians who lived in the once pristine regions of the watershed called the bay Chesepiooc, meaning "Great Shellfish Bay." Today, we know it as Chesapeake Bay. An estimated 2,700 species of plants and animals, including 200 species of fish, live in the estuary.
In recent times, bay communities have been concerned with pollution in the watershed. The results of a five-year, federally funded study that builds upon earlier studies begun in the late 1970s, identified excess nutrient pollution as the main source of the bay's degradation. These nutrients, mostly from animal waste and nitrogen used in farming and livestock management and phosphorus used in detergents, find their way into tributaries to the bay and create conditions harmful to aquatic life, such as clams, blue crab, and underwater grasses.
In the 1980s, Congress recognized the bay's pollution crisis. Thus, Chesapeake Bay became the nation's first estuary targeted by Congress for restoration and protection. Restoration of the Chesapeake Bay watershed is a collaborative effort among stakeholders, including nongovernmental organizations (NGOs), federal agencies, six states, and the District of Columbia.
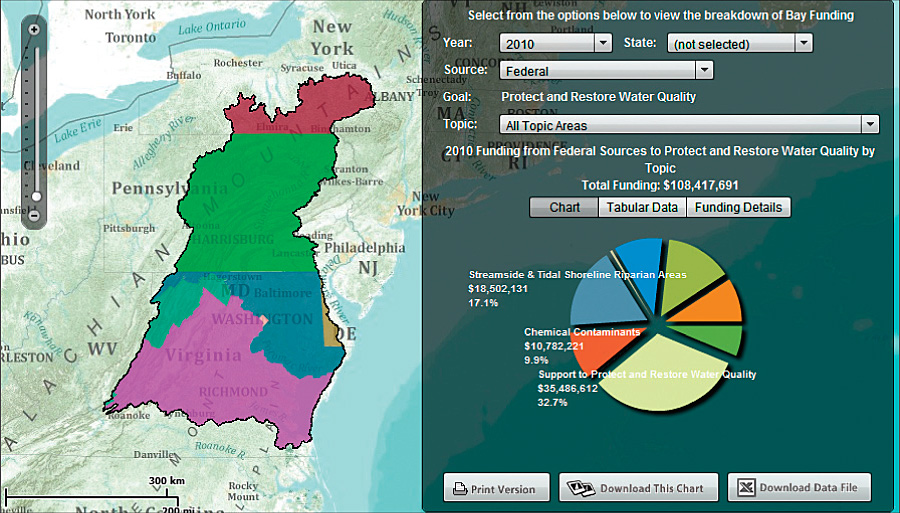
The ChesapeakeStat Web site promotes transparency by sharing performance information on funding, among other factors. Funding is presented for each of the five goal areas. Information can be sorted by year, location, source of funding, goal, and topics within goals. This image shows funding for the goal "Protect and Restore Water Quality."
The watershed is 64,000 square miles and affects approximately 17 million people. In 2009, President Barack Obama signed Executive Order 13508 that recognizes Chesapeake Bay as a national treasure and calls for an unprecedented federal effort to ensure the bay's restoration and protection. In response, the Federal Leadership Committee for the Chesapeake Bay released strategies and goals for reducing nitrogen, phosphorus, and sediment pollution; restoring 180,000 acres of wetlands; conserving another two million acres of undeveloped land; and reducing farm runoff on four million acres. The goal is to complete these tasks within 15 years.
The Chesapeake Bay Program (CBP) is a regional partnership that has led and directed the restoration of the Chesapeake Bay since 1983. One of the goals of the CBP is to provide transparency and accountability to the restoration process to ensure the public remains involved and informed about the progress of restoration. Influenced by the success of the Maryland BayStat Web-based reporting and accountability tools, the CBP formed a ChesapeakeStat team to create a similar tool.
At the May 2009 Chesapeake Executive Council Meeting, Environmental Protection Agency (EPA) administrator Lisa Jackson announced, "Governor O'Malley's leadership in developing BayStat has inspired work on a similar effort at the Chesapeake Bay Program to improve decision making and convey important information to the public. We're looking forward to creating a similar program, something like Chesapeake Bay Stat to guide the Partnership's work in the watershed."
The Executive Council formed a team that worked with Esri Professional Services and others to build ChesapeakeStat (stat.chesapeakebay.net), an online Web mapping application that allows the public, Congress, restoration stakeholders, and project managers to follow the restoration program's progress, status, and funding allocations. Esri was instrumental in developing the successful StateStat and BayStat models that were implemented under the leadership of Maryland governor Martin O'Malley. It was a natural step to work with Esri Professional Services staff in the design of the project.
"ChesapeakeStat is a geoaccounting tool," explains John Wolf, U.S. Geological Survey and GIS team leader of CBP. "GIS is a useful tool for showing people what agencies are doing and how they are spending money. But our project takes it a step further. People can see in a geographic context how an agency's goals, strategies, and outcomes are being accomplished."
ChesapeakeStat is built, in part, on ArcGIS Server and ArcGIS API for Flex. This makes it easy for site visitors to zoom to an area and locate restoration activities, then drill down into smaller watershed units to see what is happening in a specific area. The Web site is the first one-stop GIS project to improve accountability for all partners in this restoration effort. Eventually the public will be privy to all bay and watershed restoration activities, funding levels, and progress toward goals.

GIS applications give ChesapeakeStat users insight into pollutant and remediation activities. A wastewater application built with ArcGIS API for Flex accesses and displays wastewater discharge data.
ChesapeakeStat's design is closely related to the CBP Strategic Framework and describes how federal, state, and other partner funding will be used during each fiscal year. GIS has made this database user-friendly so that the public can visualize this information geographically. ChesapeakeStat organizes information around the CBP goal areas of sustainable fisheries, healthy habitats, water quality, healthy watersheds, and Chesapeake stewardship. Each category contains a suite of environmental and performance indicators.
Another unique characteristic of the ChesapeakeStat tool is that it supports an adaptive management approach, which is the CBP's management strategy that progresses through setting goals, defining strategies, setting priorities, taking actions, monitoring results, and making management adjustments. This means that beginning from the overall goal level, users will ultimately be able to drill into detailed scientific data and analysis that support decision making.
The CBP's goals and strategies are included in the design of the Web site dashboards that interactively present performance and environmental information organized by strategic topics. The database includes management activities for conservation and restoration throughout the watershed and in the estuary. The ChesapeakeStat application accesses a geodatabase that contains the spatial and tabular information visualized on the Web site. Content is organized by operational stages of measuring progress, taking action, and developing priority areas for targeting activities.
Topic-based navigation includes five major program areas that relate directly to the business goals of the CBP:
- Sustainable Fisheries (crabs, oysters, striped bass, etc.)
- Healthy Habitats (fish passages, bay grasses, wetlands)
- Water Quality (wastewater treatment, agriculture, storm water)
- Healthy Watersheds (land conservation and protection)
- Chesapeake Stewardship (public access, environmental education, citizen and community action)
Starting at these program areas, users can drill into the level of detail they need to see. These CBP business goals are categorized in the application. For example, a resource manager can select the Water Quality goal category, select the topic Wastewater, then quickly understand the collective issues and initiatives dealing with this topic in the partnership. Furthermore, the ArcGIS Server capabilities of ChesapeakeStat support scale dependency. For example, as one drills into a selection, the accompanying map interface can change as it is related to the user-selected topic.
More Information
For more information, contact John Wolf, GIS team leader of CBP, U.S. Geological Survey (e-mail: jwolf@chesapeakebay.net), or Liza Casey, Esri (e-mail: lcasey@esri.com). Access the ChesapeakeStat tool from the Chesapeake Bay Program Web site at stat.chesapeakebay.net. Read more about Esri's solutions for environmental management at www.esri.com/environment.