ArcNews Online
Fall 2010
[an error occurred while processing this directive]Fishing Catch Data Mapped Off the East Coast of India
By Tara N. Lawrence, Neil W. Pelkey, and R. S. Bhalla
Highlights
- Data can be visualized and analyzed in a short time using GIS.
- On-screen dynamic displays are quickly turned into publication-quality graphs.
- Visually exploring theories and perceptions is quick and efficient with GIS.
![]() Coastal fishing in small boats with ragged nets, refurbished motors, and overworked crews is a dangerous occupation. These days, catches seldom contain big fish complete with bragging rights. If a catch fetches enough cash for tomorrow's diesel fuel, it's a good day. If not, fish harder, deeper, and longer tomorrow.
Coastal fishing in small boats with ragged nets, refurbished motors, and overworked crews is a dangerous occupation. These days, catches seldom contain big fish complete with bragging rights. If a catch fetches enough cash for tomorrow's diesel fuel, it's a good day. If not, fish harder, deeper, and longer tomorrow.
For decades, it was clear that some form of regional management was necessary on the east coast of India. In 2004, the Banda Aceh tsunami provided both the motivation and the funding to get this under way. Boats, nets, motors, GPS units, and fish finders were distributed in nearly every community.
However, the management tools used at the government level at that time were hampered because the data used in the analysis was limited to information collected at the jetties where hundreds of men and women sold fish.
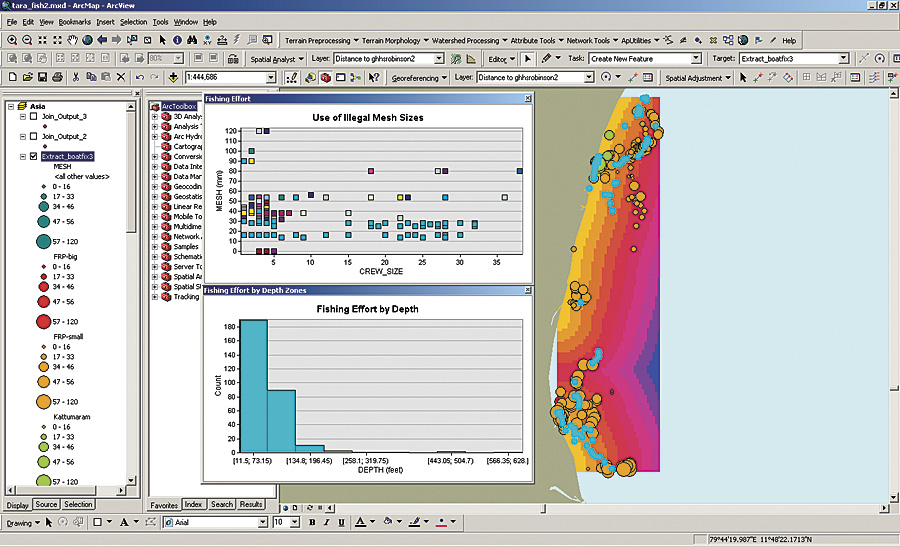
Fishing data is linked to maps and show the use of illegal mesh sizes at the respective depths and distances. This shows a clear lack of implementation of specified rules and regulations.
But, of course, fishing itself happens at a place, depth, and time with real boats, real people, real gear, and real fish of certain weights and species. The proper information to govern fisheries needs to have "what," "when," "where," "who," "how deep," and "with what" data. This information is also critical for fisheries governance in India since traditional and mechanized craft have different legally defined fishing zones.
A nonprofit research organization called the Foundation for Ecological Research, Advocacy and Learning (FERAL) purchased a commercial license in 2003, and researchers at FERAL have been using ArcGIS since then for various mapping applications within research projects. This fisheries dataset required the ability to explore the complex relationships between fishing and gear, catch, and location—a task that ArcGIS is ideally suited for. The researchers linked the dynamic mapping and graphics capabilities in ArcGIS to explore and demystify this data. They then transferred the on-screen dynamic displays to publication-quality graphs using the ggplot2 graphic plotting system designed by Hadley Wickam of Rice University, Houston, Texas.
The "what" is quite detailed, as there are roughly 243 species of fish recorded that are caught, sold, and consumed. The "where" and "how deep" questions were covered by a straightforward GIS application using existing coastline maps, GPS, and a Humminbird echo sounding device. The "when," "who," and "with what" data was supplied by observation as researchers traveled standard fishing routes in three regions of the Coromandel Coast in the Bay of Bengal. Catch data would no longer be 300 kilos of shad, but rather, for example, 300 kilos of shad caught at 79.38765 E, 12.345 N at a 20-meter depth in sandy soils by five men using 25 millimeter nets who fished from 7:00 a.m. to 8:30 a.m. on January 3, 2008.
The researchers "pinged" the fishing coordinates, depth, and substrate where they found men fishing. They also collected data on type of gear, mesh size, and target species. All data was integrated and fed into ArcGIS.
ArcGIS software's dynamic data visualization and exploratory analysis helped immediately identify data entry errors, but more importantly, it illuminated the "where" of artisanal fisheries. Researchers were also able to move the data quickly into the R programming language and ggplot2 to create publication-quality statistical graphics.
The combination of graphs linked to the map display showed many Marine Fisheries Regulation Act (MFRA 1983) violations in terms of location and gear type. It was also clear that the fish cluster, and hence so do the fishermen. The often-told story that plenty of illegal fishing occurred in these waters turned out to match the data. Banned nets and mesh sizes were used, and large trawl boats regularly fished well within the 3-nautical-mile limit.
The distance tool, combined with the extraction tool in the ArcGIS Spatial Analyst extension, provided accurate measurements of distance to shore. Knowing the distance from shore is critical, because mechanized craft are not allowed to fish less than 3 nautical miles from shore, and motorized craft cannot go beyond 12 nautical miles without additional licenses. This creates tension, since the big trawl catches of shrimp are often within 3 nautical miles of the shore and the big long-line catches of the motorized boats are often beyond the 12-nautical-mile limit.
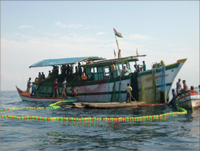
A large mechanized boat comprising up to 80 fishermen. The ring seine net often extends for kilometers, therefore resulting in considerably large catches of sardines or mackerel.
A huge plus of the GIS was the ease and rapidity of visualizing and analyzing the data. It took less than an hour to pull data from multiple sources; create and add the different layers; and define categories, such as boat size by depth or crew size by boat. After that, it was a simple matter of cleaning up errors, adding the distance grid, and redefining categories. The dynamic analysis and publication-quality maps were only a few clicks away.
Visualizing the data in ArcGIS and R was a quick and efficient way of visually exploring theories and perceptions on the fisheries sector. It took only nine days of sampling to map more than 250 boats fishing in the same zone in only a part of the Coromandel Coast. The ease with which this assessment could be done in so little time presents a useful tool for fisheries management. It was cost-effective in terms of time spent collecting the data and analyzing it and therefore could be used frequently to map fishing efforts on both coasts of India.
The real impact of the kind of fishing effort expended on a daily basis will only hit home then. Catches can no longer satiate this massive demand. Overfishing is a real issue that needs to be addressed on several levels in this complex yet dynamic sector, and a spatial context can solidify/silence any arguments raised on the ground.
About the Authors
Tara N. Lawrence is a marine biologist with the Foundation for Ecological Research, Advocacy and Learning, Pondicherry, India. Her current position as a junior research fellow involves building a qualitative and quantitative profile for the traditional and motorized sector in fisheries along the Coromandel Coast of India. Dr. Neil Pelkey is an associate professor at Juniata College, Huntingdon, Pennsylvania, whose area of expertise involves ecological modeling and environmental economics. R. S. Bhalla is a senior research fellow and trustee of FERAL. He is a landscape ecologist whose area of expertise also involves GIS and remote sensing.
More Information
For more information, contact Tara N. Lawrence (e-mail: tara@feralindia.org), Dr. Neil Pelkey (e-mail: pelkey@juniata.edu), and R. S. Bhalla (e-mail: bhalla@feralindia.org).