Climate Change Scenario Planning for Cape Cod
A Collaborative Exercise in GeoDesign
Highlights
- GeoDesign offers a new way of framing an old idea, made possible by advances in science and information technology.
- Using ArcGIS and CommunityViz, the design team ran collaborative workshops.
- Impact models gave participants dynamically updated information on important indicators.
Cape Cod is a sickle-shaped peninsula projecting off the coast of Massachusetts into the Atlantic Ocean, and its shape defines Cape Cod Bay. It has a rich and varied history, both cultural and natural. For centuries, it has been the home of the Wampanoag tribe, the native people who helped the Pilgrims of 1620 survive their first winters on the east coast of what would become the United States. By the 1850s, the area had been transformed into a home for a well-developed maritime industry. Today, Cape Cod comprises 15 towns and numerous villages.
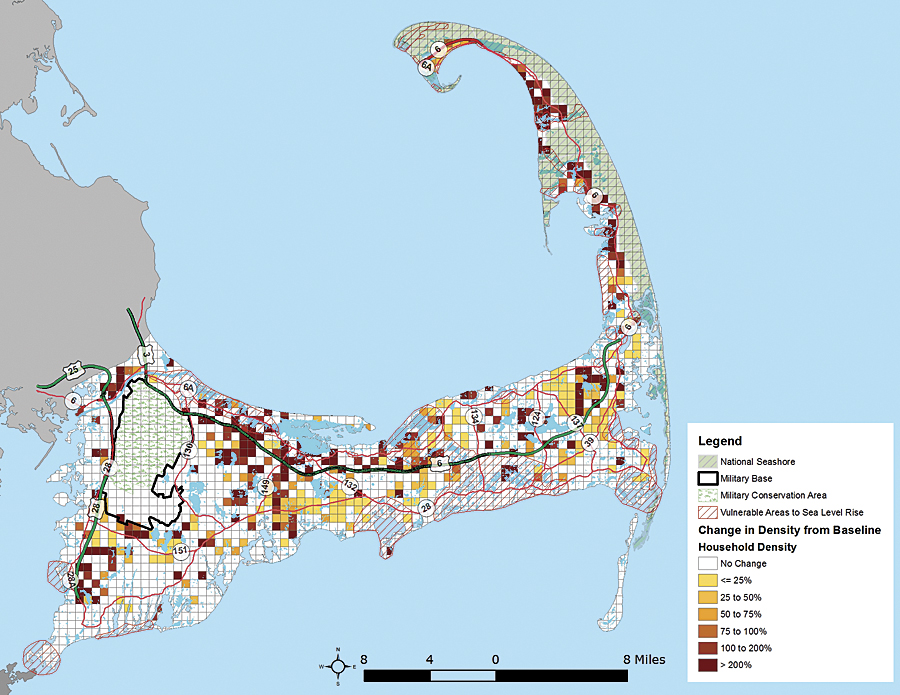
The population change map demonstrates what a dispersed pattern of growth might look like if development spreads out.
Since the cape's existence and human culture are dependent on its coastal areas, the subject of climate change is provocative. It can be argued that climate change is a natural process. So is coastal erosion. But for some, like those who live on the cape, this is of little comfort. The potential for sea-level rise and increases in storm intensity due to climate change, coupled with the impact of population growth and longer tourist seasons, have raised concerns among local and regional planning agencies about Cape Cod's future.
A Perfect Place for a Pilot Project
In 2009, a federal interagency working group selected Cape Cod as a pilot project area to address climate change. The goal was to take a systems or holistic approach to planning that looked across jurisdictional boundaries, assorted land uses, and transportation corridors in an attempt to understand their interconnected effects. In particular, the emphasis was on reducing greenhouse gas (GHG) emissions from transportation sources and assessing the effects of climate change on land use and transportation infrastructure. Cape Cod was the perfect place for such a proactive prototype, a single geographic entity from which lessons learned on a microcosmic scale could be applied to the macrocosm.
This was a perfect opportunity to put into practice many of the principles of the emerging field of GeoDesign—a design process that takes into consideration the interconnectedness between humans and nature. These basic concepts have been around for a long time. The evolved designs of some ancient fortified towns in the Sahara Desert and millennia-old Chinese cities, for example, took into account the impact of the built environment on the health and well-being of both humans and nature. GeoDesign offers a new way of framing an old idea, made possible by advances in science and information technology that were not available until recently. GeoDesign is a reaction to the realization that humans have unintentionally created many of the problems we face today and that we can ameliorate many of those problems through better design and by making reasoned changes to the landscape.
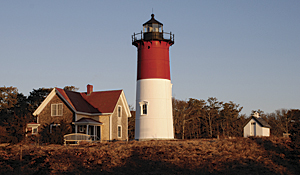
The Nauset Light, Eastham (photo courtesy National Park Service).
As part of the working group, Volpe National Transportation Systems Center began work on the pilot project to address climate change by facilitating transit mobility planning at the state, regional, and local levels. Utilizing ArcGIS for Desktop and CommunityViz, the design team ran a collaborative design charette (i.e., brainstorming workshops), taking a number of diverse stakeholders through the GeoDesign process from start to finish—demonstrating the communicative power of the process, using spatially informed models, fast feedback, and a large-format sketching environment to evaluate alternative design scenarios.
Assembling and Assessing
The design team began by gathering and assembling a reference geodatabase of diverse information about the area, including existing transportation infrastructure, land cover and use, environmentally sensitive areas, vulnerable areas, utilities, and transportation. This data was all georeferenced—that is, tied to a specific place on earth using a common coordinate system. Whether cultural or environmental, as soon as a feature is located on earth, a wealth of interrelated information begins to take form through the organizational and analytic power of GIS. The models or maps derived from this information are crucial to the GeoDesign process, for they serve as the platform for developing alternative land-use plans and management strategies.
In addition to modeling present-day conditions, the team used population growth forecasts with existing land-use and transportation plans to create a number of change models to paint a portrait of what the cape might look like 20 years in the future. How big would the population become? What type of land-use mix would be needed, and where? How would this impact the environment? Alternative scenarios looked at combinations of development and transportation system improvements.
Informed Design
Key to the GeoDesign process is the ability to design in geographic space while receiving instant feedback as to the impacts of design decisions. Everything up to this point involved the collection of data and the creation of process, evaluation, and impact models, including key performance indicators by which the impact of various design scenarios could be measured. It was time for local experts and stakeholders to convene for a hands-on workshop that began with educational briefings on key community issues, such as development options and trends; water quality; coastal erosion and sea-level rise; and the nexus between energy, emissions, and transportation.
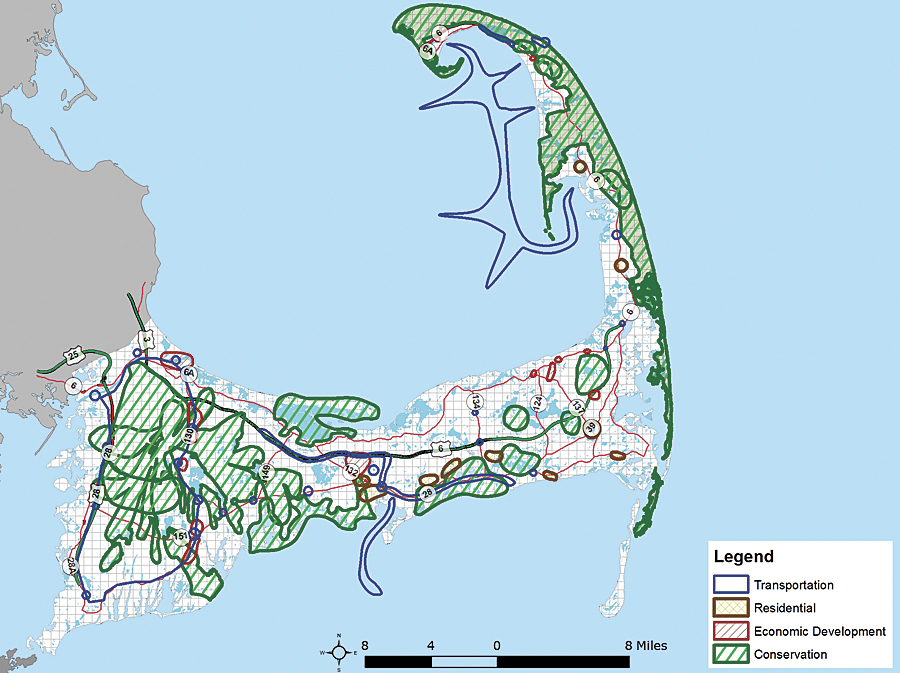
Data assembly involved the creation of a composite map using existing GIS layers and sketched additions gathered on the first day of workshops.
Participants were then divided into small groups to work on these issues, using interactive editing and sketching tools to explore potential variations in expected trends. The setup included a custom infrared pen system that allowed participants to draw on a projected image of the CommunityViz map and have their sketches entered directly into the computer.
The Transit Alternatives exercise, for example, looked into possible extensions or changes to the planned transit routes in Cape Cod. After participants sketched new transit stops on the map, the impact model gave them dynamically updated information on important indicators, like population served and GHG emissions. Based on the results, participants could change their minds and revise their sketches.
The GeoDesign Experience
The Cape Cod case study provided a real-life demonstration of key aspects of GeoDesign, both the process and how it enables technology:
- Sketching—GeoDesign-enabling technology is key for its ability to rapidly sketch a design in geographic space.
- Spatially informed models—Modeling made heavy use of georeferenced spatial information and calculations, such as distances, densities, and networks.
- Fast feedback—Technology improvements in the last several years have made it possible for exercises like this to work in real time, with participants seeing immediate indicator updates from their sketches.
- Iteration—The workshop was set up to allow participants to modify their sketches, immediately view impacts, and save multiple iterations during the design process.
The Cape Cod exercise participants responded favorably to the digital approach to GeoDesign, saying the technology gave them new insights into factors they had not previously considered. The Volpe National Transportation Systems Center and its partners also learned some valuable positive and negative lessons about their specific techniques and GeoDesign in general.
An Interagency Exercise
Participants and contributors to this exercise were the Fish and Wildlife Service; the Interagency Working Group on Transportation, Land Use, and Climate Change, led by the Federal Highway Administration; the National Park Service; other federal, state, regional, and local agencies; PlaceMatters; Placeways, LLC; the Transportation Research Center; the University of Colorado, Denver, Center for Sustainable Infrastructure Systems; and the Volpe National Transportation Systems Center, a research branch of the US Department of Transportation's Research and Innovative Technology Administration.
For more information, contact Ken Snyder, PlaceMatters (e-mail: ken@placematters.org) or visit www.placematters.org. For the complete report, visit the Volpe Center. For more information on how to put GeoDesign into practice, contact Mr. Shannon McElvaney, Esri (e-mail: smcelvaney@esri.com) or visit esri.com/geodesign. For more information on CommunityViz, contact Doug Walker, Placeways (e-mail: info@placeways.com), or visit www.placeways.com.