Understanding Earth Changes with Landsat Viewers
Landsat is the longest continuously running earth monitoring system, collecting millions of multitemporal, multispectral scenes covering the entire planet. July 23, 2012, marked the 40th anniversary of the first Landsat satellite launch, and Landsat data still remains the best way to understand global land cover, providing a window on earth changes. People use Landsat because it is more efficient than any other technology at meeting the same decision support requirements. Landsat data has grown significantly in value with each passing year and, since 2008, has been available free of charge from the United States Department of the Interior's US Geological Survey (USGS). Since that time, the use of Landsat has skyrocketed to more than eight million scenes.

LandsatLook imagery of Redlands, California, from September 2002. The LandsatLook Viewer makes available more than 800 Landsat scenes covering the city ranging in date from 1973 to 2012.
When working with massive datasets, like Landsat, one of the obstacles encountered early on is how to make the data accessible to users in an easily digestible format. People working with Landsat want to be able to find the information they are looking for; extract the information; and move on to their work, which involves solving some of the most complex problems affecting our society today. There are two Landsat viewers available online that help users do just that—the LandsatLook Viewer from USGS and the ChangeMatters Viewer from Esri.
Both of these viewers use ArcGIS technology to serve Landsat as web services, accessing many terabytes of imagery. Web services are one of the most common ways to share large datasets of information over the web, because users can easily access and analyze the information online from the web application and through other devices, platforms, and applications that can consume web services. This includes most smartphone and tablet devices, desktop applications, web applications, and ArcGIS products.
The USGS LandsatLook Viewer enables anyone to go anywhere and see how the world has changed in the last 40 years, with high temporal resolution. The LandsatLook Viewer provides access from any web browser to the complete archive of more than three million Landsat scenes. Using the LandsatLook Viewer, users can zoom to any location on earth and use a simple time slider to look through thousands of overlapping scenes for their area of interest, going all the way back to 1972. The LandsatLook data displayed is 30-meter resolution, three-band composite natural color images. Queries can be made to restrict scenes to specific date ranges, cloud cover, and sensors, and simple image enhancements can be applied to highlight features. The displayed images can be downloaded, and there is access to the full USGS Landsat scenes, if required. In the first two weeks, the LandsatLook viewer was visited by people from more than 90 countries. Get started with the USGS LandsatLook Viewer.
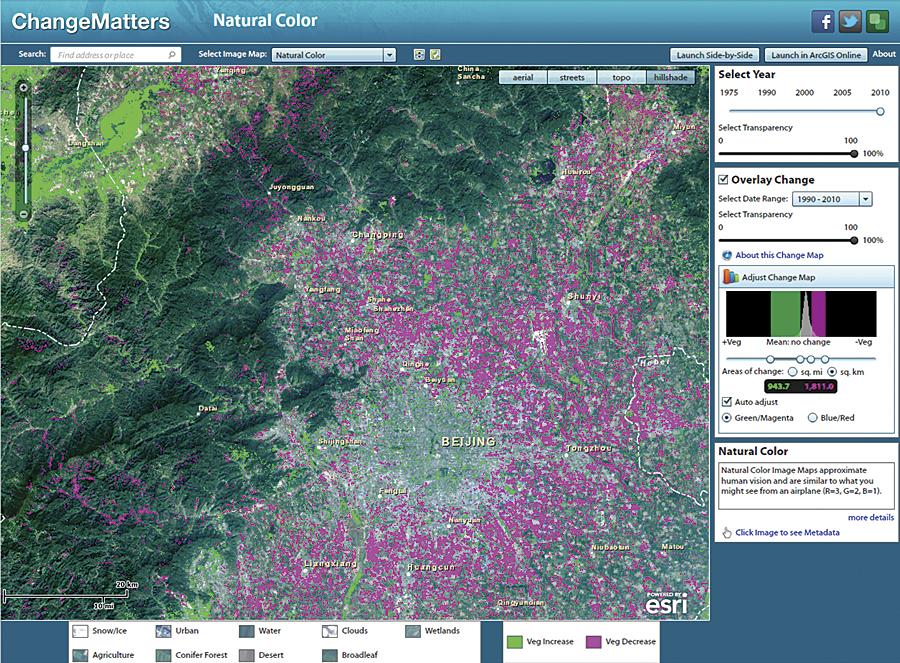
The ChangeMatters Viewer shows vegetation changes in Beijing between the years 1975 and 2010.
The second viewer available on the web today is the Esri ChangeMatters Viewer. This is a powerful yet easy-to-use web application that provides simple access to the entire Landsat Global Land Survey (GLS). The GLS datasets are collections of the best cloud-free Landsat scenes from the five epochs, circa 1975, 1990, 2000, 2005, and 2010. The ChangeMatters Viewer uses ArcGIS as the underlying technology to additionally process the Landsat GLS dataset on the fly into multiple data products that are served as the World Landsat Services on ArcGIS Online. These web services make all the Landsat data quickly accessible with the ArcGIS Online server providing all the image processing. The ChangeMatters Viewer makes it easy to understand global earth changes in vegetation, urban growth, deforestation, natural disasters, etc. The ChangeMatters Viewer also includes a simple Normalized Difference Vegetation Index analysis that calculates the change difference in each pixel from one epoch to another. This is displayed on the screen in two shades, green and magenta, which represent vegetation increase and vegetation decrease, respectively.
An easy way to get started with the ChangeMatters Viewer is to watch the ChangeMatters Tips tour. This is a live, interactive tour that provides tips for using the ChangeMatters Viewer to understand the Landsat data. Esri has also applied the new ArcGIS 10.1 advanced imagery processing, correction, and enhancement tools to the web services used in the ChangeMatters Viewer. These new tools include the apparent reflectance function, which provides radiometric corrections to the displayed imagery; raster functions that can be applied to the 1975 epoch to simulate color views of the earth from the Landsat Multispectral Scanner series data by utilizing a virtual blue band; and the ability to automatically destripe scenes that contain the Scan Line Corrector problem, which resulted in data gaps.
Both the USGS LandsatLook Viewer and the Esri ChangeMatters Viewer are leveraging standard, commercial off-the-shelf ArcGIS products to serve massive volumes of Landsat imagery worldwide.
To learn more, go to esri.com/imagery.