Spring 2002
Spring 2002 |
|||||||
|
|
|||||||
ArcGIS Water Utilities Data Model Customized
City of Germantown, Tennessee, Implements Water Inventory, Modeling |
|||||
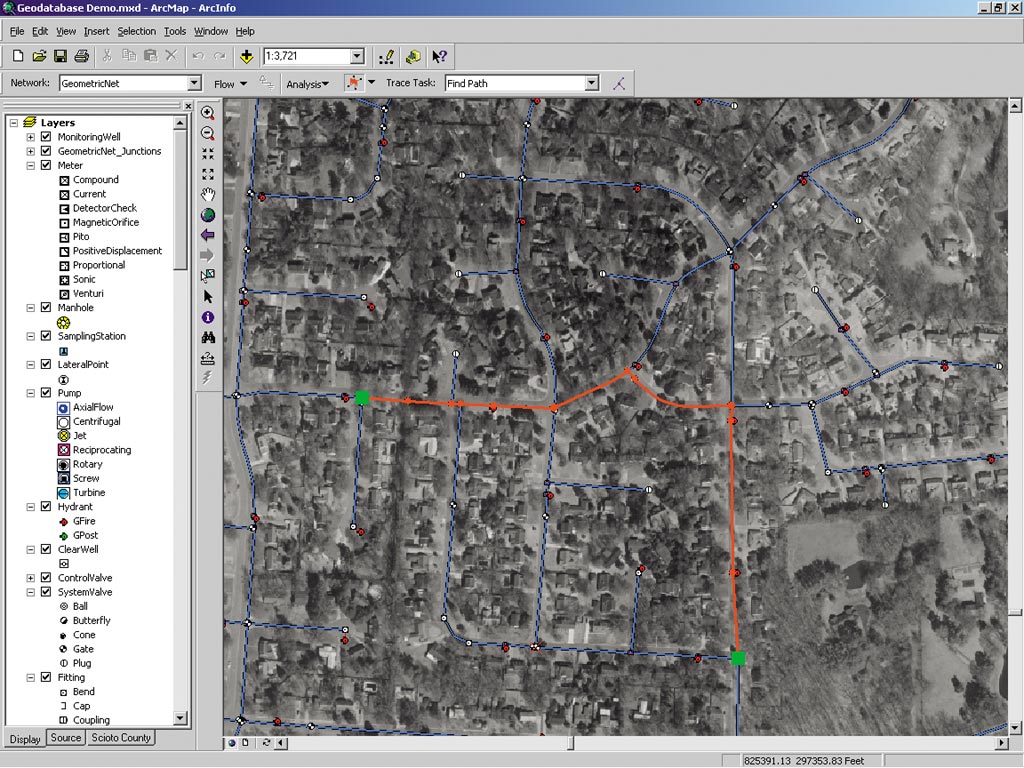
The City of Germantown, Tennessee, maintains approximately 950,000 feet of water pipe over 17.5 square miles and has a water distribution system that serves some 40,000 people through approximately 12,000 installations. However, the City did not have a complete and accurate digital mapping inventory of its water network. Because periods of drought in recent years had produced severe water shortages, the City sometimes had to purchase water from Memphis Light, Gas & Water (MLGW) to meet demand. The City of Germantown needed to build a more complete and comprehensive inventory of its water utility assets. In the past, the City had maintained its water data--including water mains, valves, fire hydrants, and monitoring wells--on a single 1" = 500'-scale Mylar sheet. Using digital orthophotography, the City had just completed planimetric data compilation, including water structures such as hydrants and valves, and wanted to update and convert its hard-copy water map into a GIS that would be spatially accurate with the new basemap. Once the inventory was updated, the City wanted to create a skeletonized version of the water network suitable for hydraulic modeling. Engineers could then run "what if" scenarios so system deficiencies could be identified, repair-and-replace strategies developed, and capital improvement plans made. Germantown was seeking an integrated solution. So the City upgraded to ArcInfo 8 and purchased a water modeling package that could use GIS data to construct and calibrate a hydraulic model. "We didn't have the time or money to develop a custom GIS database design from scratch," said Janiece Riggins, project manager and a GIS analyst in the City's Department of Community Development. "We wanted an efficient, out-of-the-box database design because we wanted to spend more time modeling and less time worrying about databases." Esri had suggested the City use the ArcGIS Water Utilities Data Model (formerly ArcFM Water Data Model), a free object model for water and wastewater utilities that required the development of an object-oriented GIS data model--Esri's geodatabase. "We attended an Esri seminar on the ArcGIS Water Utilities Data Model, and the package seemed really comprehensive," Riggins said. "The model provided a framework that would address our needs."
The City selected Woolpert LLP, an Esri Business Partner, to develop the geodatabase and the hydraulic model. "The ArcGIS Water Utilities Data Model got us up and running quickly," said Scott Cattran, a GIS project manager at Woolpert. "With a few tweaks here and there, we were able to create a database design that supported the City's inventory and modeling needs." Only minimal customization of the ArcGIS Water Utilities Data Model was performed. Some examples include the following:
As a result, the database design took weeks instead of months to develop and was more cost-effective for the City's needs. "We used Esri's MapObjects to create a custom utility tool set for developing the water distribution network," Cattran said. Valve and hydrant locations from the digital orthophotos and planimetric mapping were used with the 1" = 500'-scale hard-copy schematic map as the basis for connecting water pipes. Because the Germantown project began when Esri's geodatabase data model was still being tested as ArcInfo 8 beta, Woolpert developed the GIS layers using ArcView shapefiles. After data development was complete, Woolpert created a process for migrating the shapefile data to a geodatabase. Data migration had to be planned carefully with a table mapping document so that sources in the shapefiles matched the appropriate targets in the geodatabase. "For example, to migrate the City's pipe data, we needed to map the distribution lines to the appropriate subtype in the pressurized main class and hydrant lines to the appropriate subtype in the lateral line class," Cattran said. "ArcGIS provides wizards so we could match each source with the target." Instead of defining connectivity rules in UML, Woolpert used the ArcCatalog application in ArcGIS. "Our focus was modeling, not editing, and more connectivity rules may be established over time," he said. "Storing connectivity rules in ArcCatalog rather than directly in the model removes the need for further data migrations." The "flag and solver" tracing tools in the ArcGIS ArcMap application were used to ensure topological integrity was maintained with the migrated data. The City now uses ArcMap validation tools to update and maintain edits to its geodatabase water network. The Department of Community Development runs ArcInfo and ArcView on two Dell Precision 220 computers--hardware chosen for its speed and performance. "The City wanted to take advantage of the latest and greatest tools in the ArcMap application," Cattran said. "The superior editing and out-of-the-box functionality for tracing paths and valve isolation-type work reduce the need for expensive custom application tools." Woolpert then used the GIS to create a skeletonized version of the water network as a data input file for the hydraulic modeling package, WaterCAD 4.1 by Haestad Methods, also an Esri Business Partner. "We wanted to use the data we had in the GIS, and we wanted to integrate the GIS with the hydraulic modeling package," Riggins said. By using GIS data to feed the hydraulic model, Woolpert didn't have to create a modeling network from scratch. Woolpert used ArcGIS spatial operations to assign customer demand information--taken from the City's billing database and stored in parcel centroids--to modeling nodes and extracted elevations from Germantown's Digital Terrain Model (DTM). "After the GIS layers had the necessary modeling information, we ran the model to determine the ability of the system to meet present-day demand and where future capital improvements were needed," Cattran said. The City learned it needed more elevated storage and a larger diameter line to the feeding tank to maintain system pressures under peak conditions. "We're really pleased we were able to address our inventory needs for operations and maintenance--and our modeling needs for engineering--in a single project," Riggins said. For more information, contact Janiece Riggins, City of Germantown (tel.: 901-757-7245, e-mail: jriggins@ci.germantown.tn.us) or Scott Cattran, Woolpert (tel.: 1-800-414-1045, e-mail: scott.cattran@woolpert.com). |