Spring 2003
Spring 2003 |
|||||||
|
|
|||||||
In Japan, GIS Helps Save a Coastal Plain From Land Subsidence |
|||||
By Guoyun Zhou and Tetsuro Esaki, Kyushu University, Japan Saga Prefecture, located in southwest Japan, is a coastal plain with a population of 880,000. Since 1957, most areas of the plain have been subsiding; the accumulative land subsidence value in the plain is 1.2 meters since 1957, and the total area of subsidence covers 320 square kilometers. This land subsidence has caused many problems such as the increased risk of flooding, building and irrigation pipe system damage, and pumping facility failure. How to confine the land subsidence has long been a sensitive and serious problem for the prefecture government. The government of Saga and the research group of Kyushu University of Japan have launched a joint investigation research project using GIS to define the regional land subsidence mechanism and to create a simulation model for determining subsidence confinement countermeasures. Past field investigations have suggested that the land subsidence is caused by large-scale groundwater pumping. At present, yearly groundwater pumping for the whole plain, mainly for the purpose of agricultural irrigation, is more than 10 million cubic meters. Hence, determining the extent and position of the groundwater system beneath the plain surface and establishing a plainwide groundwater flow model are critical for clarifying the land subsidence mechanism. However, to establish such a plainwide groundwater flow simulation model, data for large-scale spatially distributed processes (e.g., land elevation, precipitation, evapotranspiration, runoff, geology, and permeability distribution) is essential. In the past, due to the difficulties of capturing, storing, and processing such large-scale spatial information, a synthetic groundwater system model could not be established. Revealing Patterns Below the Surface
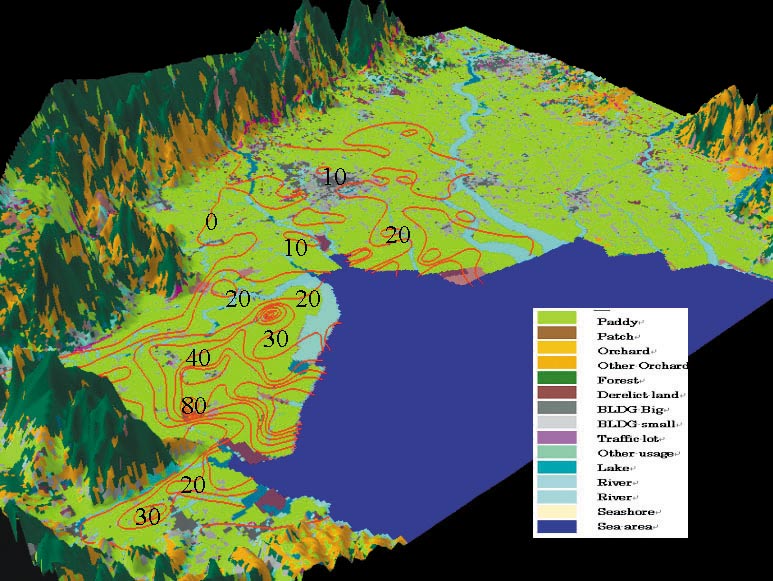
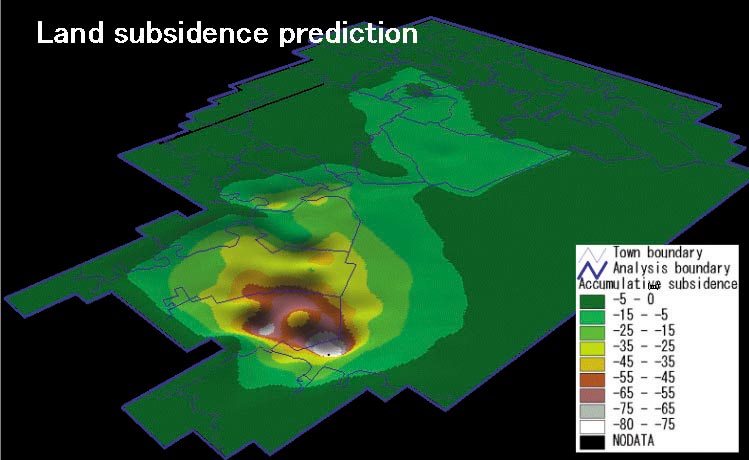
Now, however, ArcView software is being used in the joint project to help reveal the actual groundwater flow under the plain. The first task was to make clear the temporal and spatial conditions of the water infiltrating the groundwater system due to rainfall and irrigation. Researchers used ArcView to gather and process all necessary spatial data. Next, they established six GIS data layers covering the whole plain--a digital elevation model (DEM), land use, precipitation, evapotranspiration, runoff, and agriculture irrigation water. The DEM was created by interpolating elevation point data with 50-meter pitch provided by the Geographical Survey Institute of Japan, and other benchmark data was also used for increasing the interpolation accuracy. A land use map was created that consisted of more than 250,000 square polygons with sides of 100 meters each. A three-dimensional land use map was thus created by using the DEM and land use polygons, allowing the land use condition of the whole plain to be viewed three dimensionally for the first time. Manipulating the DataPrecipitation and evapotranspiration observation point based data was determined in the following manner. The locations of eight important weather observation stations were input into the GIS as points. Monthly precipitation and temperature data for the years 1979 through 1999 was converted from Microsoft Excel data sheets to the attribute data of the points. The evapotranspiration values for the points were calculated and added as the attribute data for the points. Assigning all of this point-based data into plane-distributed data was a challenge. The most important aspect was determining how to find the control area for every weather observation station. Most often, a method of polygon formation called Thiessen division was used, and the division was implemented manually. In this work, researchers wrote an ArcView extension for the Thiessen division method and used it to identify all control areas as polygon themes. They reassigned the attribute of every weather observation point to the control polygon using the spatial join function in ArcView. As a result, more than 20 years of monthly precipitation and calculated evapotranspiration data was stored in each control polygon as attribute data and can now be easily queried. Researchers created runoff and agriculture irrigation water quantity distribution layers using a land use layer, a precipitation data layer, and a land use based runoff coefficient. All the data was stored in ArcView as square polygons. To make different layers with different polygon sizes compatible, all polygon layers are transformed to square polygons with sides each one kilometer long and with the summation value as attribute data. In every one-kilometer square polygon, four kinds of attribute data are stored--precipitation, evapotranspiration, runoff, and agriculture irrigation water quantity. The infiltration quantity in every one-kilometer square polygon area can be calculated as the difference between incoming water (precipitation and agriculture irrigation water quantity) and outgoing water (evapotranspiration and runoff). As a result, the water infiltration quantity distribution was obtained as 240 layers corresponding to every month from 1979 to 1999. Researchers found that during irrigation seasons, the average infiltration quantity was about 10 millimeters/day and less than one millimeter/day during the rest of the months. Modeling, Clarifying, and PredictingThe second task in this research was to establish a three-dimensional plainwide groundwater flow simulation model and subsidence calculation model by using GIS spatial data. Researchers built aquifer thickness distribution, permeability distribution, and surface elevation as grid data and exported it as ASCII files. Divided finite element modeling mesh (FEM) polygons in GIS were exported in DXF format for groundwater flow simulation code. The third task was to clarify the land subsidence mechanism. By using the newly established model, past groundwater flow and land subsidence conditions were simulated with good agreement. Researchers found that seasonal groundwater level fluctuation due to the intensive water pumping has been a critical cause of the land subsidence. Finally, future land subsidence was predicted considering three water pumping scenarios with calculation results displayed in ArcView and overlaid with house, road, and land use layers. It has been found that to confine land subsidence to within one millimeter/year, current water pumping quantity should be reduced by at least 50 percent. For more information, contact Guoyun Zhou (e-mail: zhou@ies.kyushu-u.ac.jp) or Tetsuro Esaki (e-mail: esaki@ies.kyushu-u.ac.jp). |