Spring 2004
Spring 2004 |
|||||||
|
|
|||||||
Balancing Continuity, Containment, and Free Movement
Brussels International Airport Forms Evacuation Scenarios With GIS |
|||||
Brussels, Belgium, is the power base of the European Union (EU), and as one of Europe's top tourist destinations, the city attracts people from all over the world. Brussels International Airport is a busy place with a babel of languages—the EU alone accounts for 11 official languages, and there are a host of others from countries as diverse as Ireland and Luxembourg—and a mix of people from frequent flyers to first timers. Coming together all at the same time are business visitors in a hurry, arriving in the morning to leave again the same evening; more leisurely visitors starting a week of sight-seeing; travelers from all over EU heading off to see friends or family; 21,000 airline and airport employees; and nine million square feet of floor space. It's like market day in a small town where a lot of people are slightly bewildered, first-time visitors. When dealing with the development of evacuation scenarios, it's also a place where three imperatives meet—continuity, containment, and free movement:
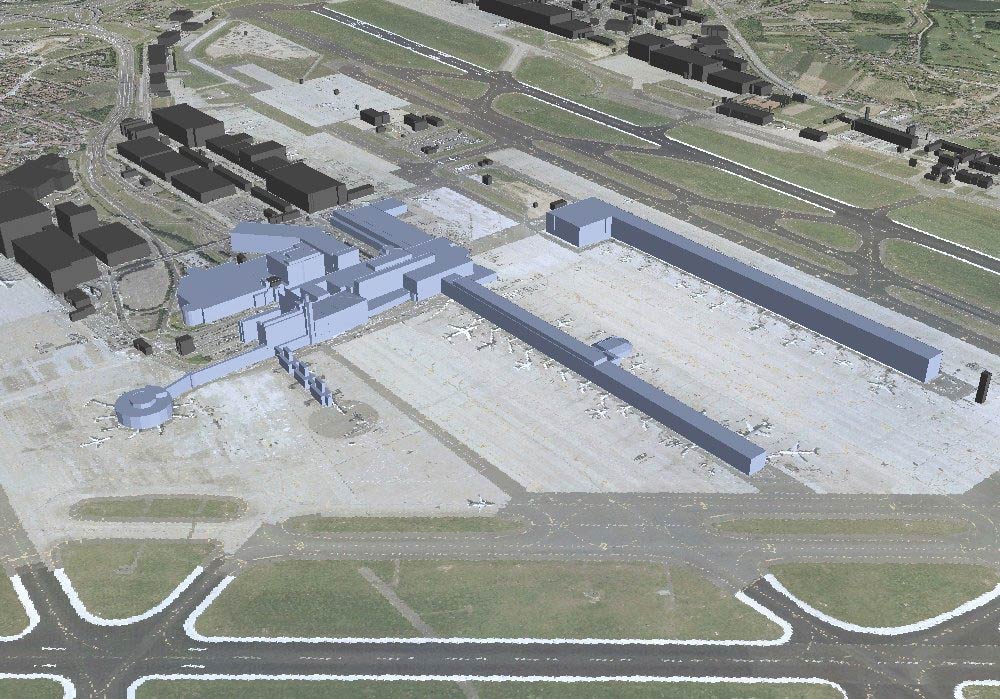
Drawing up fire or evacuation scenarios that balance these conflicting requirements is no trivial task. Incident scenarios for the airport must meet exacting safety requirements for public sites and buildings, as defined in both national and European legislation. These scenarios must define the airport's response to any incident, typically a fire, that makes it necessary to evacuate people in the affected area. They must contain complete information on measures for limiting the spread of smoke and containing the fire. They must take any special features of the building design into account and must include information on how the scenarios are validated and kept up-to-date. They must guarantee that security will not be compromised. To make it even more challenging, all these requirements have to be met while minimizing the impact of any incident on continued, normal operation of the airport. Remember, there are thousands of people passing through who haven't been there before and may not necessarily understand announcements in various languages. Additionally, you cannot close a whole terminal just for a small fire in a restaurant kitchen. In Brussels, these incident scenarios are the responsibility of the GeoData Management Group (GDMG). A department of the airport's Information Technologies services company, GDMG began life when the airport operators of Brussels International Airport Company (BIAC) started work on a new terminal in 1996 and needed high-quality data to implement facilities management. After playing a key role in the Pier A project—a new terminal for flights within the EU's "Schengen" zone that opened in May 2002—the group now manages all airport-related operational data.
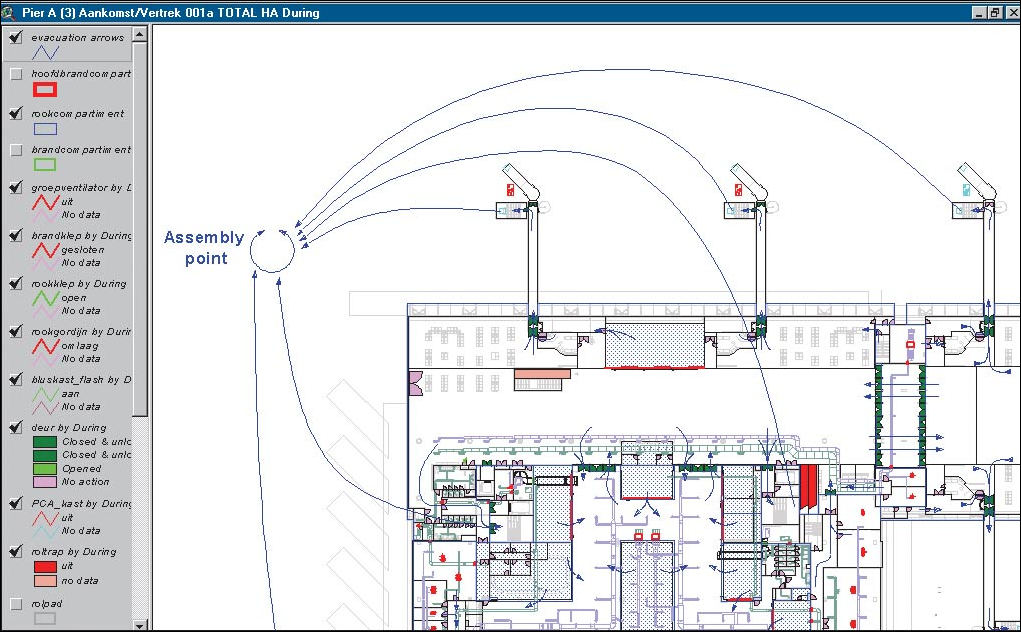
When the need for GIS analysis became apparent, GDMG investigated the technology, then determined that ArcView fit its needs. The group uses ArcView 3.x to help them access and integrate data from many sources so that fire and evacuation scenarios are always complete and up-to-date. Integration and interaction are key to the GDMG approach, typified by the way it has implemented data maintenance. Full information on any new work is sent to GDMG by the companies involved, as required by BIAC, and an easily accessible, Web-based process makes it easy to notify of changes. It's constant two-way traffic: Users submit their data for management and request information (for example, plans and maps) they need to work with. GDMG and users work together to guarantee the quality of all data available. Users with access to AirportView GIS, an ArcView 3.x software-based application, can combine graphic data with digital information for a complete, easy-to-understand picture of the response to a fire. Which zones will be affected? Which fire curtains will close? Where is the nearest fire fighting equipment? What is the quickest evacuation route? Where will smoke extraction fans start? Which security doors will be unlocked? Which emergency signs will be illuminated? Where are there hazardous or flammable substances? Which emergency power units will come online? In fact, the complexity is almost impossible to describe efficiently in text—a complete scenario can affect anything from a 200-foot moving walkway to a sprinkler head an inch or so across and show the situation before, during, and after the incident. There are already 500 scenarios to maintain and more than 20,000 pieces of equipment included in the databases. Before GDMG and full computerization, these scenarios were based mainly on paper drawings (frequently out of date) and annotations either stored in a spreadsheet or written directly on the drawings themselves. These scenarios were impossible to maintain effectively and almost impossible to validate. A safe evacuation route, for example, might have an impact on doors and signaling on more than one floor of a building or even in several buildings. Another drawback to the paper-based approach was that the annotated drawings were very hard to read when all the various consequences for a small area had to be noted. Now that all the information is available in electronic form, it has been possible to complete a thorough review and update of all the scenarios. The design phase took 17 working days for 129 scenarios, followed by 23 days for computer-based checking. The first results were available in a matter of days, not months. Plans were then printed off showing all the equipment involved in the scenarios, and within six weeks these plans were used to carry out a complete check in situ. It is now easy to schedule regular checks, too. Thanks to the data driven nature of the scenarios, any discrepancies identified during these on-the-spot checks are immediately corrected in the data sources, not just noted on paper copies—so the whole airport community constantly benefits from high-quality information. The new scenarios are displayed on-screen, where users can zoom in or out as required, hide or display different types of equipment, or work with "what if" queries to evaluate changes in advance. In fact, the information display is now good enough for the scenarios to be part of the training program for emergency services teams at the airport. They can see at a glance exactly what impact a fire in any given zone or location will have and what equipment is available. Developing and maintaining emergency scenarios is perhaps the most high-profile task keeping GDMG busy, but its ability to select and display related data from a number of sources means it also contributes to space management, cable management, and many other projects within the airport. With GDMG's skill (and proven success) in processing and delivering high-quality geographic data, it has been asked to contribute to environment-related projects such as mapping noise contours and keeping flight paths free of obstacles. For more information, contact John White, GDMG manager (e-mail: john.white@switch.be). |