Spring 2004
Spring 2004 |
|||||||
|
|
|||||||
National Bridge Inventory Data Made GIS Ready |
|||
|
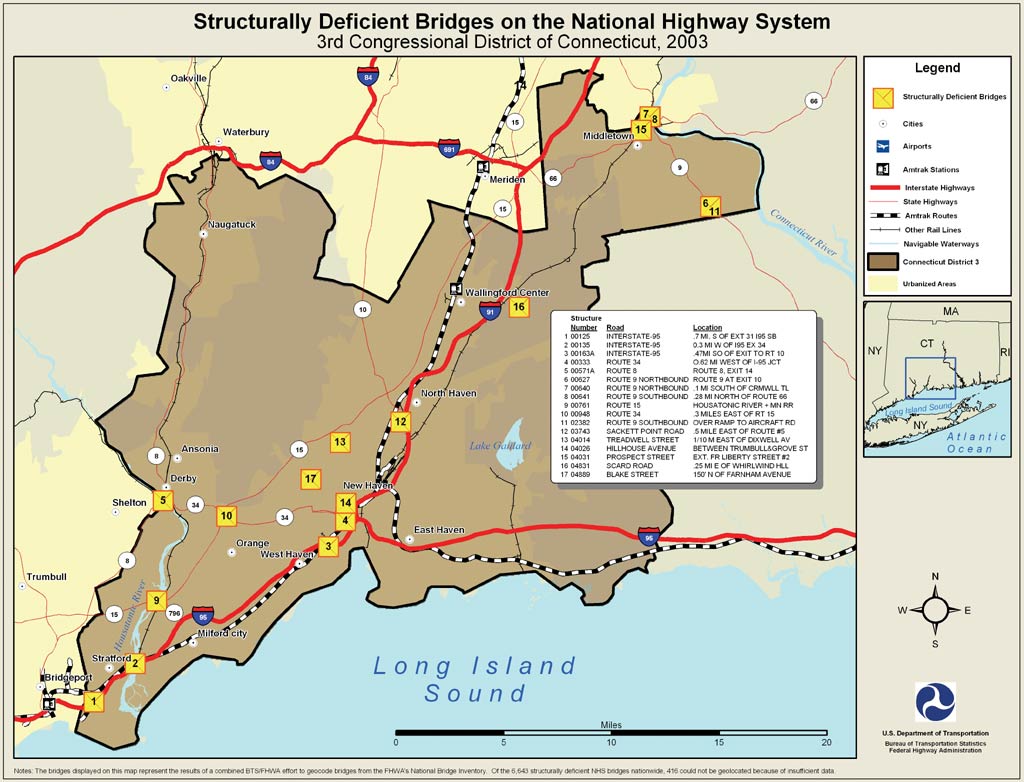
The United States Department of Transportation (USDOT) Federal Highway Administration (FHWA) is charged with keeping the nation's highway transportation systems safe. After the 1967 collapse of the Silver Bridge over the Ohio River between West Virginia and Ohio, which resulted in 46 deaths, Congress conducted hearings and established a law that marked the beginning of uniform standards for inspecting bridges. The law originally required that the states need only inspect bridges on the federal-aid highway systems but was expanded to include all public road bridges more than 20 feet long. The law further requires that the Secretary of Transportation, in consultation with the states, maintain an inventory of these bridges.
In April 1971, the first National Bridge Inspection Standards (NBIS) were issued to satisfy the mandate of Congress, and by the end of 1973, most federal-aid highway bridges had been inventoried. Today, the National Bridge Inventory (NBI) is substantially complete for all public road bridges and contains data collected and maintained in accordance with the FHWA "Recording and Coding Guide for the Structure Inventory and Appraisal of the Nation's Bridges." NBIS also establishes criteria for inspection procedures, frequency of inspections, and personnel qualifications. Approximately 590,000 bridges lay along the network of roads that crosses the United States. Bridges have a wide range of attributes and classifications such as cable style, suspension, arch, segmental concrete, and truss. Their constructions range from simple to complex. Other definitive characteristics include load and resistance factors, seismic design, and supporting elements such as ultra high strengths of concrete or steel. A bridge may contain intricate wall systems or feature hydraulic structures that involve complex stability countermeasures built into its design. Accounting for all U.S. bridges is complex because of the enormity of the count and the numerous variables included in bridge classification. Of particular interest to government agencies is bridge data about ownership, types, usage, levels of deterioration, and location. FHWA uses the NBI information to determine investment requirements; develop national data summaries for reports to Congress; respond to inquiries from Congress, the National Transportation Safety Board, and others; and provide support for formulating national policy. Bridge inventory maps were requested by Congressman James L. Oberstar, a senior member of the House Transportation and Infrastructure Committee. Oberstar, representing the Eighth Congressional District of Minnesota, is sometimes referred to as the nation's transportation guru. From USDOT's Bureau of Transportation Statistics (BTS), he requested maps of deficient bridges on the national highway system. To meet this request, bridge inventory data needed to be geocoded. Following a street data vendor evaluation process, BTS contracted Geographic Data Technology, Inc. (GDT), an Esri Business Partner, to perform the monumental geocoding task based on evaluation criteria that included coverage, geocoding ability, and willingness to work with the department. The mission was to precisely locate as many of these bridges as possible by matching NBI attributes to corresponding attributes within GDT's proprietary feature database. This was accomplished in two ways: through point conflation and manual intervention. In the point conflation process, attributes associated with a bridge, such as the route carried by the bridge and features passing beneath the bridge, were compared against feature names within the database. When a reliable match was obtained, the coordinates of the feature's intersection were assigned to the bridge. On the other hand, if a match was not obtained, or if a match was suspect, the bridge was queued up for manual review. In this review, editors used street, hydrology, rail data, and aerial imagery to aid in locating the bridge. Having adequate attribution on both the bridge and database features was key to achieving a match with a high level of confidence. A key challenge throughout this process was that the NBI file was an assemblage of multiple state databases containing a fixed set of bridge attributes. Unfortunately, some attributes were not always described consistently from state to state. Methods and procedures to consistently extract the value of these attributes were developed, maximizing the match rate achieved using GDT's existing conflation process. FHWA reports that approximately four million miles of roadway are within the country's transportation system. Working its way along this vast network, the coordinates of more than 460,000 of the nation's bridges (out of 590,000) within one year were captured. This significant sample provides the basis for some interesting geospatial analysis. Steve Lewis of BTS managed the project. Lewis explained that once GDT submitted the geocoded bridge data, it was loaded into a coverage. The coverage was converted to shapefiles. After performing quality controls to make sure the bridge data was showing that the bridges were indeed where they should be, a combination of templates and ArcInfo functionality was used to create the maps that Congressman Oberstar requested. Congressman Oberstar's initial request was for maps by congressional district for each member of the Transportation and Infrastructure Committee. After delivery of these maps, Oberstar requested additional maps for each member of the House, more than 430 maps. The complete set was delivered to Oberstar in February 2004. This was an impressive display of ArcGIS capabilities to an impressive body. But these maps are just the beginning of what GIS can do with the geocoded bridge data. Geocoded data in tables can be linked to other data tables to add more variables to a study. Using GIS for spatial analysis of the nation's bridges, a researcher could prioritize areas that should be targeted for immediate service. Another query could show the effects of weather conditions such as heat and wind or what consequences salt and chemical compounds have on the deterioration of bridges and how these trends in deterioration correlate with regions of the United States. For example, studies could be performed on correlations of bridge corrosion factors and the cold regions of Maine or the salty coastal regions of Florida. The researcher could validate a hypothesis about how certain bridge structures affect traffic congestion and how bridge structures and improvements are interrelated with urban development. From these types of spatial analyses, an engineer may be able to consider a design strategy in the context of a more detailed and accurate understanding of place and location. ArcGIS allows for the inclusion of multiple variables to be added to analysis. It also aggregates outcomes for easy understanding. Most central, GIS thematic maps show numerous perspectives for visual understanding and interpretation. These maps could provide both the engineer and the policy maker a clear picture that is useful for making informed decisions that affect the nation's transportation system. Although FHWA has no stated mapping mission, it is, nonetheless, already reaping benefits from the newly geocoded bridge inventory project. GIS is showing current bridge deficiencies on a map, and this is beginning to turn heads. For more information, contact Stephen Lewis, GIS applications manager, USDOT/Bureau of Transportation Statistics (e-mail: steve.lewis@bts.gov, tel.: 202-366-9223), or GDT (tel.: 1-800-331-7881, Web: www.teleatlas.com). |