Spring 2004
Spring 2004 |
|||||||
|
|
|||||||
The Colorado Geological Survey Maps Development With GIS |
|||||||
|
Colorado, one of the fastest-growing states in the United States, faces many development-related challenges. Its government, citizens, and businesses are confronted with balancing growth and development in areas subject to natural hazard threats and preserving natural resources needed to sustain urbanization. Most of the state's growth is occurring along the Colorado Front Range, an area from the eastern foothills of the Rocky Mountains to the Colorado Piedmont-the short grass prairies of the high plains. The entire Front Range urban corridor, home to 80 percent of the state's population, spans from Cheyenne, Wyoming, in the north to Pueblo, Colorado, in the south. In 2001, the Colorado Department of Local Affairs projected a 51 percent population increase over the next 25 years. Maps and data that support careful planning and decision making are essential to the preservation of Colorado's exquisite beauty and quality of life.
The Colorado Geological Survey (CGS) (Denver, Colorado) is a participant in STATEMAP, a grant program for state geological surveys, administered by the U.S. Geological Survey (USGS) National Cooperative Geologic Mapping Program. STATEMAP provides matching funds to produce new geologic maps in areas undergoing major development such as Colorado. Each year, CGS applies for funding to support detailed mapping of bedrock and surficial deposits in development areas coinciding with USGS 7.5-minute quadrangles. The new geologic information is used by decision makers at all levels of government and business to confront a wide range of land use planning issues including geologic hazard location and potential. Seeking an alternative to its hard-copy system and to improve productivity of a manual mapping process, CGS turned to Esri Business Partner Leica Geosystems GIS & Mapping's ERDAS IMAGINE software and Esri's ArcGIS software. CGS has been using ArcInfo since 1991 and found Leica Geosystems' suite of products to be compatible and easy-to-use in conjunction with the ArcGIS suite of products. Staff members of CGS, including geologists and GIS specialists, participate in STATEMAP mapping projects using the software on Dell Pentium 4 workstations. The geologists begin their fieldwork by using a pen to mark the contacts between geologic units (such as sandstone and limestone) and geologic sample locations on existing aerial photography. After returning to the GIS lab, they scan the aerial photos and input them into IMAGINE OrthoBASE, an add-on module for IMAGINE Professional. Spreadsheets with control point coordinate data for the aerial photos are also input into the module. Additional tie points are created, and the data is saved as an IMAGINE block file. Next, the contacts between geologic units, structural information, and sample locations are digitized in Leica Geosystems' ERDAS Stereo Analyst. The geologists review and update the data for quality and accuracy in ArcGIS. The data can easily be used for 3D viewing in IMAGINE VirtualGIS or ArcGIS Image Analysis.
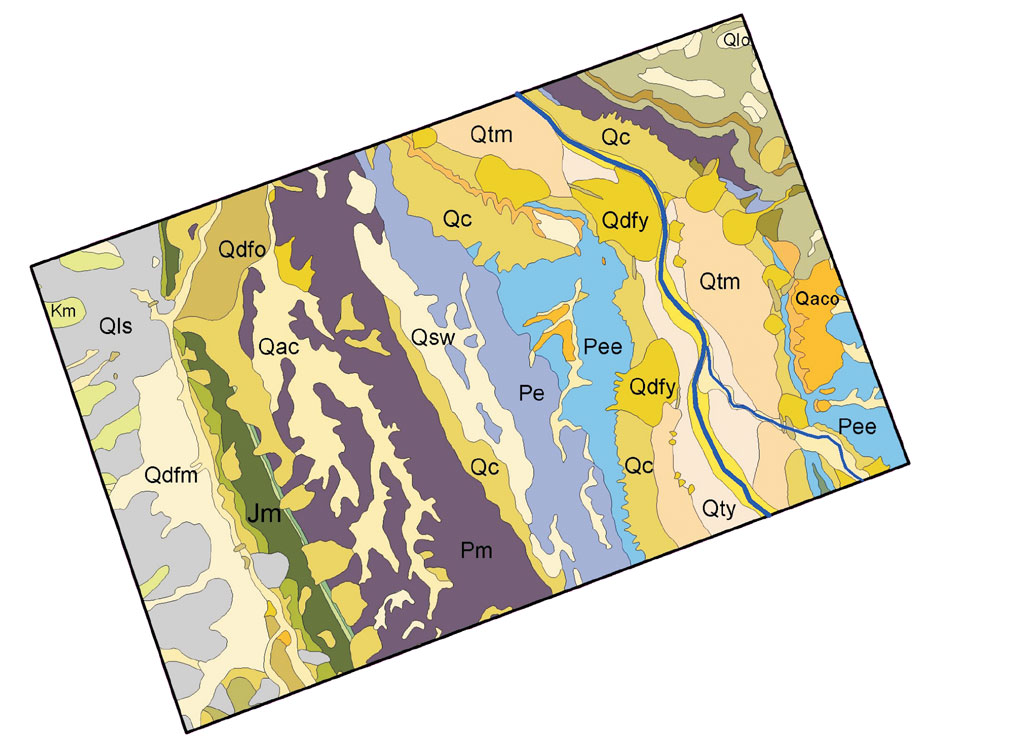
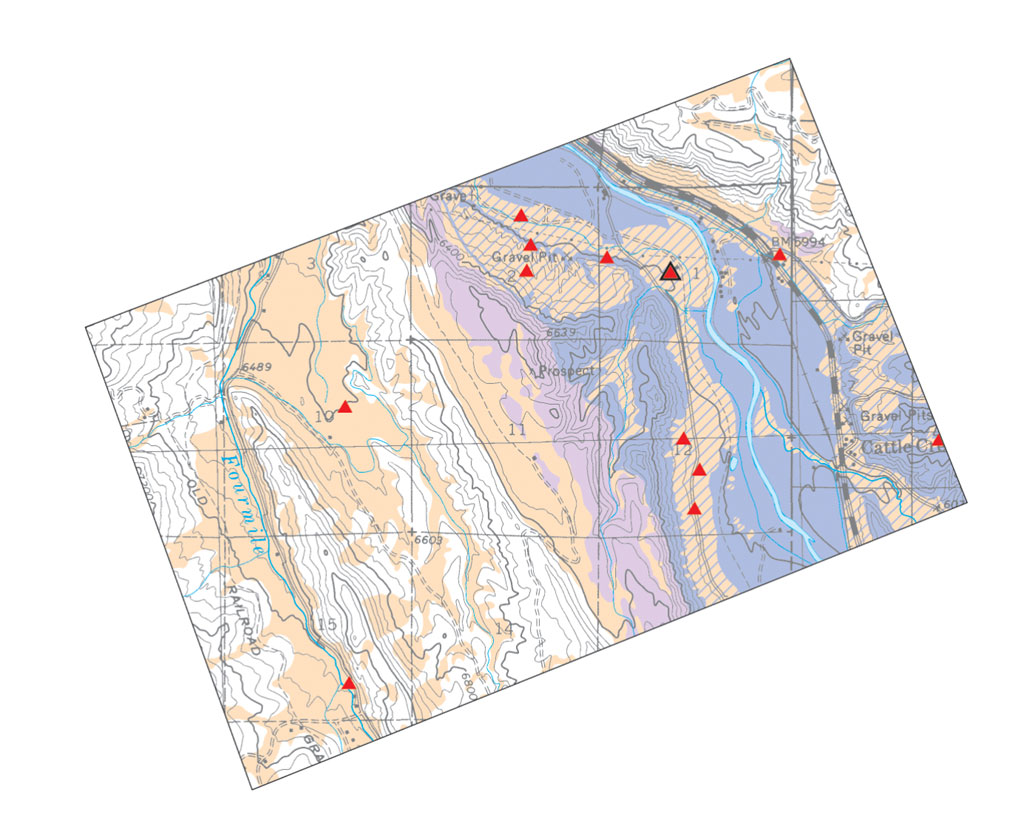
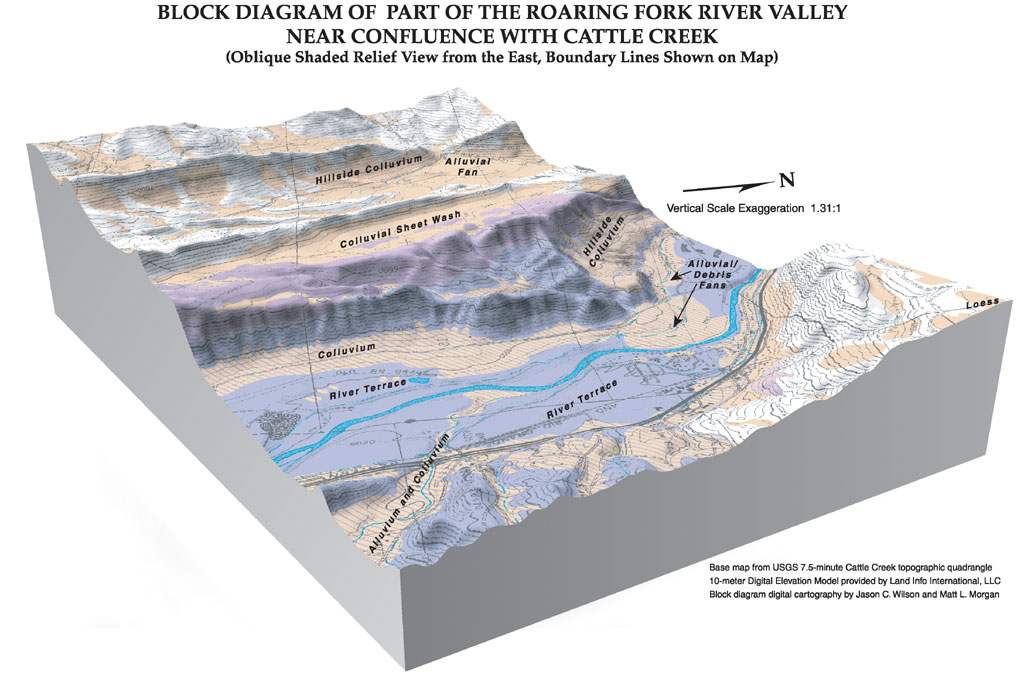
"The digitized files are then turned over to the GIS analysts for processing and cartographic enhancement," states Matt Morgan, mapping geologist for CGS. The analysts merge the bedrock layers into one line file and create polygons in ArcInfo. "We have implemented a series of review steps for the data," explains Jason Wilson, CGS geographer and GIS analyst. "The geologists verify the polygon files and clean the data using ArcGIS Desktop (ArcView). For example, they might move lines to match the 1:24,000-scale quadrangle maps." After the final edits by the geologists, cooperative internal and external peer data reviews are performed. "When the data creation and reviews are complete, the cartographic enhancement process begins using the ArcMap application in ArcGIS Desktop," continues Wilson. "The entire process, from data collection to providing several final deliverable map quadrangles to USGS, takes approximately 11 months," according to Morgan. Each quadrangle covers approximately 55 square miles. He adds, "By using digital mapping technology, we have reduced the time needed to create these maps by approximately six months, a significant amount of time and cost savings." The final data is delivered to USGS and is available as shapefiles and map plates (PDFs) for viewing and analysis by CGS and its constituencies. One STATEMAP program goal is to make data available for land use planning. This will help planners mitigate or avoid the effects of hazardous geologic events and conditions at development sites. Jonathan White, senior engineering geologist at CGS, used ArcView and Colorado STATEMAP quadrangles to prepare geologic hazard maps. This included landslide susceptibility maps covering approximately 80 square miles in the western portion of the city of Colorado Springs and collapsible soil maps of the Roaring Fork Valley in west-central Colorado. Landslide Susceptibility Mapping in the City of Colorado SpringsLandslides, natural occurrences common throughout Colorado, are defined by USGS as "the downward and outward movement of slopes composed of natural rock, soils, artificial fills, or combinations thereof." According to USGS, landslides in the United States are estimated to cause property damage in excess of $1 billion per year. Railroads, bridges, highways, homes, and entire communities can be damaged or buried. USGS also states that landslide damage to buildings in Colorado alone is estimated to exceed $3 million per year. Identification of susceptible landslide areas allows planners to mitigate or avoid the worst hazard zones by requiring additional geologic and soil testing on proposed development sites. This ultimately can save money, time and, in severe cases, life. According to White, "Areas that are susceptible to landslides can frequently be identified by the similarity of geologic materials and topographic conditions in areas of known landslide activity." White and map coauthor T.C. Wait began creating landslide susceptibility maps by identifying weak geologic formations that are important in terms of slope stability and conducive to landslides such as claystone. White and Wait used a georeferenced digital elevation model (DEM) to create a slope classification map and performed a slope aspect analysis. The geologic formation map data, available from the STATEMAP quadrangles, was then overlaid on the DEM and displayed in ArcView. "Next we inventoried and digitized previous landslides within the city," explains White. Landslide location information was available from the CGS STATEMAP quadrangles, other published USGS maps, consultant reports performed by the city or developers, and photointerpreted landslide areas that were identified in orthorectified photography provided by the city. White and Wait also used a five-foot pixel DEM, provided by Colorado Springs Utilities, which helped identify landslide areas. After overlaying and analyzing the data with ArcView, site visits were needed to verify whether a location was a landslide or if it would still be classified as a questionable area. White and Wait recorded attribute and location data in the field with a field laptop computer and ArcView. The authors then used the field and geologic data to digitize landslide susceptibility zones for publication using ArcView. "It should be noted that we didn't perform true stability analysis," says White. "We are simply stating that areas of similar geology and slope in the city have had landslides in the past. And if development is proposed on susceptible areas, additional geologic and soil testing is recommended." The landslide susceptibility maps cover the forested Rocky Mountain foothills, which are attractive development areas because their elevation provides good views of the city lights and the plains. Unfortunately, these areas are also susceptible to landslides. "The bedding is tilted away from the mountain front to the east, which is also the aspect of the slope," explains White. The steeper ground slopes of the mesas are undercutting the bedding planes. Such "daylighting" of these tilted formation beds can create adverse conditions for long-term stability and risk to development. "The maps are really a disclosure mechanism to allow planners and developers to consider potential landslide hazards up front," comments White. Collapsible Soils Mapping in the Roaring Fork ValleyCollapsible soils form in arid to semiarid climates. They can have high strength when dry, but they weaken and rapidly collapse when wet and under weight or "load" such as buildings or roads. According to CGS, soil volume can be reduced by as much as 10-15 percent, which results in surface ground displacement of several feet. This settlement can damage and destroy roads and other structures and change surface drainages. Human activity, including landscape watering, failure to repair leaking water lines in utility trenches, altering surface drainage, and building heavy structures, is the main cause of collapsing soils in Colorado. The Roaring Fork Valley in west-central Colorado follows the Roaring Fork River from Aspen to Glenwood Springs through Garfield, Eagle, and Pitkin Counties. This area, like so many other areas of the state, has experienced significant development pressure because of its beauty and access to outdoor recreation. The valley also hosts a significant amount of collapsible soils. According to White, "We performed an analysis along approximately 20 miles of the Roaring Fork Valley. The final map product is similar to the landslide susceptibility maps in that it allows planners and developers to see the potential hazards before building." White began by collecting case histories of collapsible soil locations as identified in geotechnical reports (swell-consolidation tests) provided by local consultants or where actual distress or damage of structures by settlement was discovered. He then performed site inspections to study the geomorphology types and soil deposits. Using this data and other research from around the United States and throughout the world, he identified the types of geologic deposits that can generate collapsible soils. Next, White used ArcView to select the relevant surficial deposit polygon data (e.g., alluvial fans, sheetwash, and colluvium) from the STATEMAP quadrangles. "I also had to consider the bedrock units that the surficial deposits developed from," explains White. "For example, colluvium derived from basalt, a type of lava, is stable, but colluvium derived from evaporite (shaded as purple and blue in Figures 2 and 3) or clay and silt-rich formations may be highly collapsible." He eliminated areas that have stable bedrock. White then merged the polygons into one geologic unit. In addition, he plotted the precise location of the case histories on the maps. From this combination of data, White created zone maps displaying areas of potentially collapsible soil. "The end users of these collapsible soil hazard maps are land use planners, geotechnical consultants, developers, and home owners," states White. "Like the landslide susceptibility maps, this is a mitigation and disclosure tool. By using this data, the map users can recognize the up-front need to perform geotechnical subsurface soil studies in sites considered for development in collapsible soil areas."
"The use of imaging and GIS has changed the way that I perform my job," continues White, "especially over the last six years. Now I take my laptop or pocket PC with Esri's ArcPad out to the field and rarely have to pull and file a paper map. This significantly improves the efficiency of my work." For more information on the Colorado STATEMAP project, contact Vince Matthews, Colorado State geologist (e-mail: vince.matthews@state.co.us); Matt Morgan, CGS mapping geologist (e-mail: matt.morgan@state.co.us); or Jason Wilson, CGS geographer/GIS analyst (e-mail: jason.wilson@state.co.us). For more information on geologic hazard mapping, contact Dave Noe, chief of Engineering Geology (e-mail: dave.noe@state.co.us), or Jonathan White, CGS senior engineering geologist (e-mail: jonathan.white@state.co.us). STATEMAP data may be downloaded or purchased from the CGS; contact Randy Phillips, chief of GIS and Technical Services (e-mail: randal.phillips@state.co.us). Visit the Colorado Geological Survey at geosurvey.state.co.us. Visit the University of Colorado, Colorado Springs, Web site (web.uccs.edu/geogenvs/hazards) to view and/or download geologic hazard data, including landslide information. (As of January 2004, the components of IMAGINE OrthoBASE are available as part of Leica Geosystems' new Leica Photogrammetry Suite.) For more information on spatial solutions, contact Leica Geosystems GIS & Mapping (toll-free tel. in the United States: 1-877-463-7327, tel. outside the United States: 404-248-9000) or visit Leica Geosystems GIS & Mapping at gis.leica-geosystems.com. |