Spring 2009
Spring 2009 |
|||||||
|
|
|||||||
GIS Provides Tools to Streamline Cartographic Processes in the Australian State
Digital Mapping Is Cutting Edge in Tasmania |
|||
Highlights
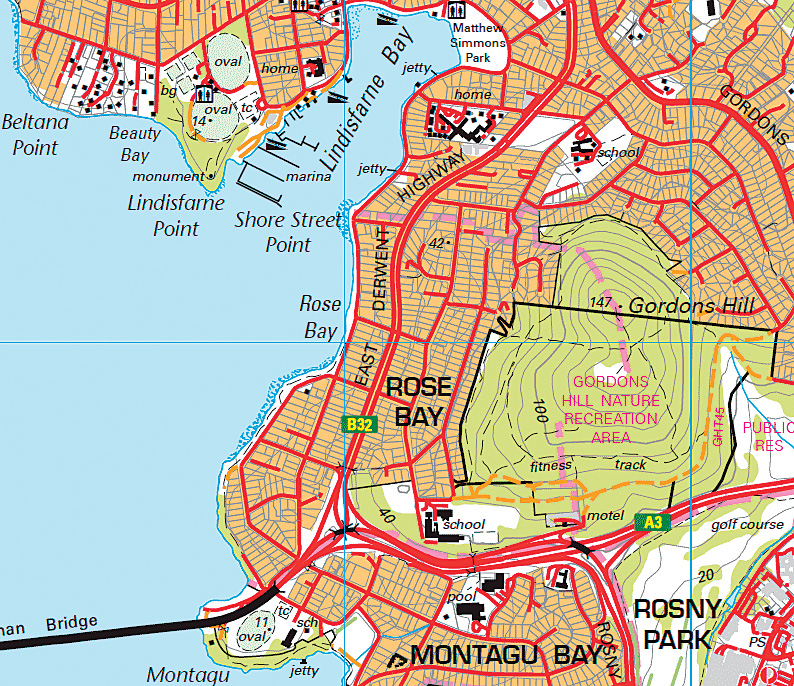
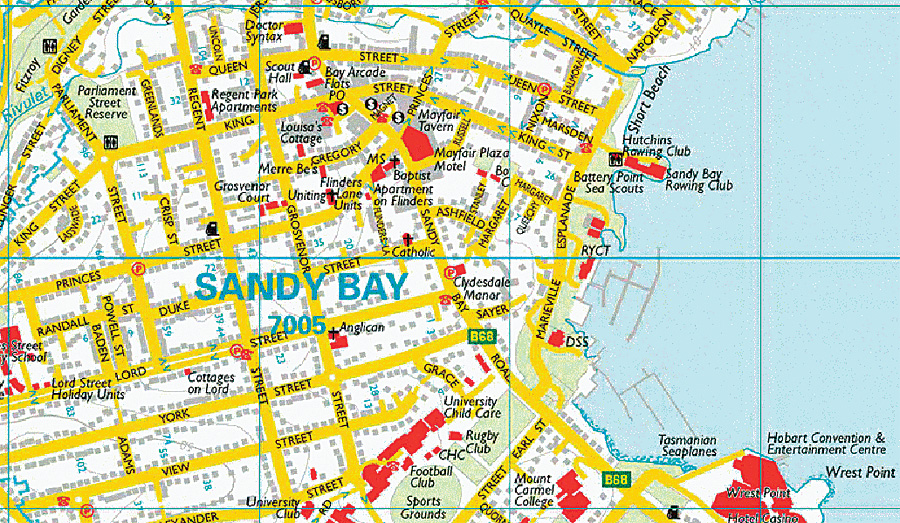
Tasmania is Australia's only island state, consisting of more than 300 islands. Made up of 1,000 mountain peaks and some of the world's rarest animals, the state is a popular tourist destination. As a vacation spot, it has much to do; more than 40 percent of the state is national park and reserved land.
Managing the state responsibly is no small feat, and to do so, it is important to know where everything is located. This task is managed by the state government's Department of Primary Industries and Water. Branded TASMAP in the 1970s, the mapping group creates a variety of topographic mapping products, from a wide range of series maps to national park maps, tourism products, and a comprehensive street atlas. The most popular map series is the 1:25,000-scale map series, which began in the late 1970s and consists of 415 maps covering the entire state. This map series provides large-scale basemaps for all of Tasmania and consists of topographic information, such as elevation, water bodies, and government landmarks, along with property information. "Completing this series was a huge task," says Mark Chilcott, spatial operations, Geodata Services, Department of Primary Industries and Water. "We are now in a revision cycle to update the maps, some of which are now more than 20 years old." Obviously, producing 415 maps leaves limited resources, and employing GIS technology allows more efficient production management. "The question is always, which one do I work on?" states Chilcott. Following a selection process 10 years ago, TASMAP chose Esri GIS software to manage, create, and edit all necessary map layers digitally. In 2004, TASMAP upgraded to ArcGIS Server. Moving to GIS has helped the department update mapping information more quickly and also allowed them to offer maps for sale and free downloadover the Internet. When moving to the digital age, TASMAP focused on building on the past to look toward the future. "It was important we didn't reinvent the wheel," says Chilcott. "Cartography is not a dead art; it is very much a required skill. And while the specifications for creating maps are the same, the methods are obviously quite different."
Upgrading TASMAP's mapping process was broken down into four main areas: marginal information, data extraction and geoprocessing, cartographic editing and production, and printing. Marginal InformationAll marginal information is stored as an attribute to the feature that represents the map. All changes to the attributes are managed through an easy-to-use form that simplifies editing and reduces the potential for mistakes. For example, map marginal information involved creating an ArcGIS Desktop template that sets out the page size and location of all the "objects." The template contains the map frame and all the marginal information, including map name and number, north arrow, grid reference, climate graph, and any other information required. Feature classes represent both map extents and attributes that can be calculated for all the marginal information objects. Even the north arrow is calculated from a formula, since magnetic north changes from year to year. Grid references are created from a sample point that is unique for each map. A staff member edits data for new points and precalculates the Universal Grid Reference. Climate graphs are created from climate data obtained from the Bureau of Meteorology (BOM). Map names, numbers, editions, and dates, as well as the cover and location box, are also objects created from code. Following the initial setup, the end results are that each margin and template takes less than one minute to generate, mistakes and errors are greatly reduced, and a considerable amount of work is saved. "Now, our cartographers can focus on cartography," says Chilcott. Data Extraction and GeoprocessingExtraction and geoprocessing of the map data are performed on the editor's desktop in a personal geodatabase with FME software. Using this software to build graphic geoprocessing models automates data manipulation from a variety of sources. New information is created by applying geoprocessing operations to existing data, such as clip to boundary; making single layers into multiple layers; joining lookup tables; and rotating objects like waterfalls to rivers, gates to roads, and buildings to roads. Eleven different models running one after another are coupled with Visual Basic code in ArcGIS Desktop to complete the geoprocessing. The models vary in complexity and require in-depth knowledge of the data. Although developing these models took considerable time, now geoprocessing takes only 20 minutes and vastly reduces mistakes and errors. Cartographic Editing and ProductionThe third challenge TASMAP solved was cartographic editing and production. The top issue was placement of annotation, which is now created directly from the data itself using Esri's Maplex for ArcGIS extension. Maplex for ArcGIS manages symbolization and placement of annotation through user-defined rules based on map complexity. Annotation placement is prioritized according to sophisticated cartographic rules, and filters are set up to handle densely packed annotation in urban areas differently than filters for annotation in rural areas. The changes TASMAP has seen with digitally managing annotation include a significant reduction in time spent to create the maps. "Traditionally, 'lettering the map'—the process of selecting the type, preparing the names, and placing them in position—was considered among the more complex and time-consuming parts of the cartographic process," explains Chilcott. "Now it is significantly less time-consuming and considerably easier than in the past." PrintingThe last challenge in the workflow of cartographic production is printing. TASMAP produces maps using offset printing, sending maps in PDF files to the printers. The maps are created using standard cyan, magenta, yellow, and key black (CMYK) color. Chilcott adds, "Recently, we began to export the almost-completed map to Adobe Illustrator for finishing to ensure that the CMYK color separation for offset printing could be achieved." GIS for the Entire ProcessTASMAP has witnessed significant changes in map production methods since it began creating the series more than 30 years ago. "Before GIS," Chilcott explains, "map production involved intricate manual processes with a single map sheet taking many people months to produce." A feature class of the map extents is linked to the stock database in ArcGIS to produce maps and reports of real-time stock levels, predicted stock levels for the coming 12 months, and where the highest selling areas are. ModelBuilder, the interface used to build and edit geoprocessing models in ArcGIS, is used to create a weighted matrix to model these factors to assist in identifying which maps should be worked on over the coming 12 months. In the past, it took up to four cartographers 6 months to produce a map. "Today, maps can be produced quickly and efficiently in about two weeks by automating many of the mundane tasks," Chilcott says. ArcGIS is now used for the entire mapping process—from data extraction, editing, and finishing to the final export to PDF for printing. "No other application needs to be used in the entire process," Chilcott emphasizes. Chilcott points out that one of the main factors for the success of the project was the fact that it was a team effort and the cartographers were on board from the start. More InformationFor more information, contact Mark Chilcott, spatial operations, Geodata Services, Department of Primary Industries and Water, Tasmania (e-mail: Mark.Chilcott@dpiw.tas.gov.au), or visit www.tasmap.tas.gov.au. |