Spring 2009
Spring 2009 |
|||||||
|
|
|||||||
Mapping the Potential for Biogas Production in a Norwegian County |
|||
|
by Ragnhild Vognild, Governor's Office of S�r Tr�ndelag, Norway Highlights
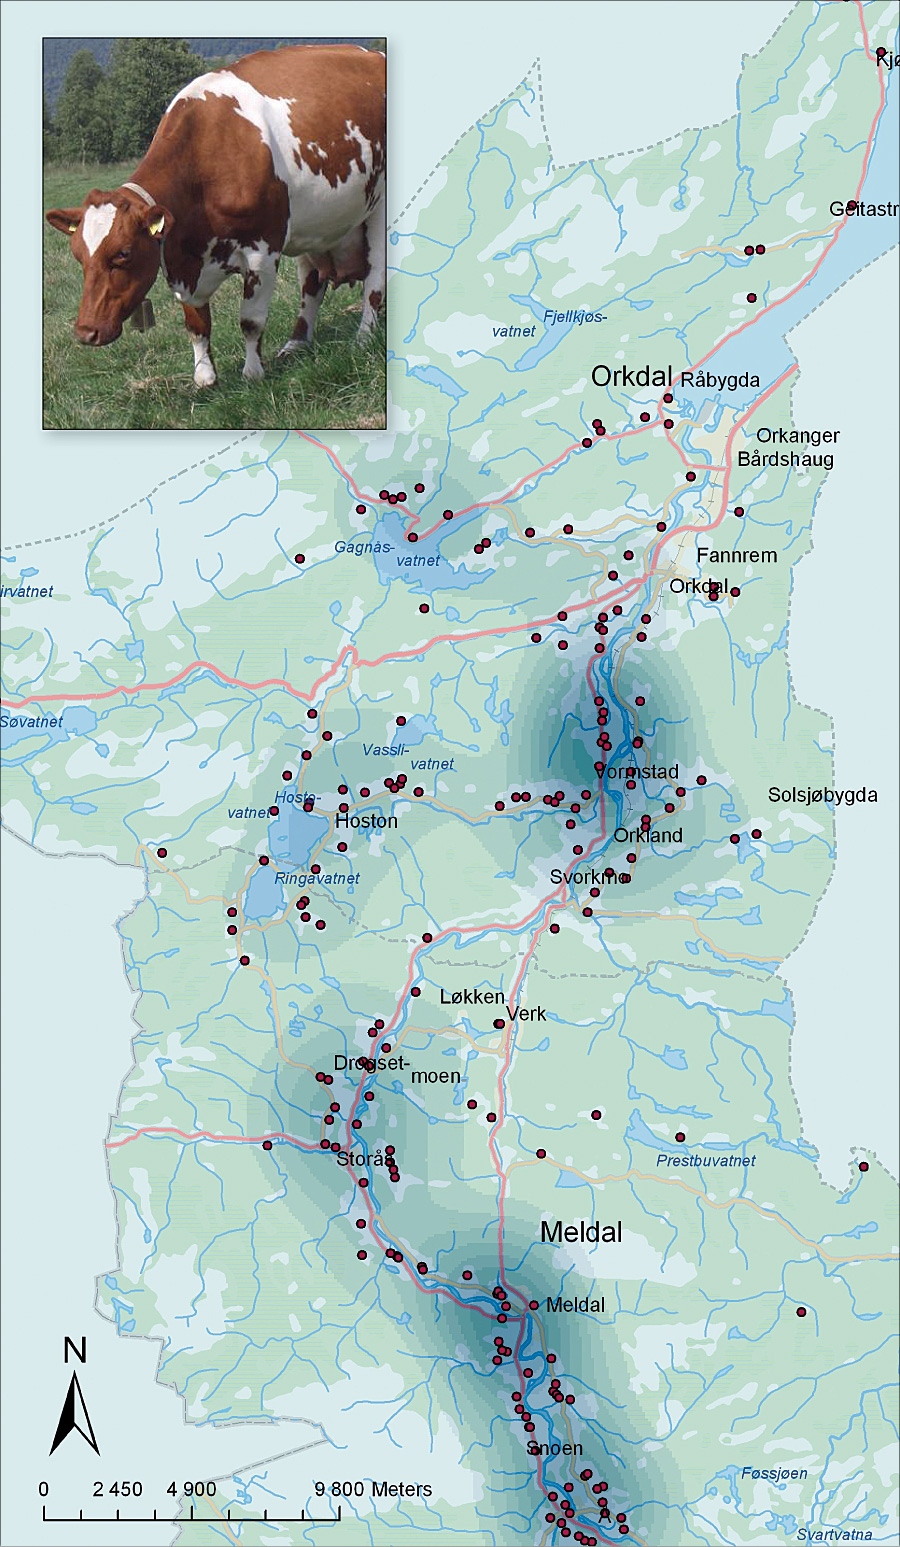
Small-scale farms are scattered throughout the rolling landscape of S�r Tr�ndelag County in Norway. Most farms have animals and, accordingly, a significant amount of animal manure, which is a great resource for biogas production. Geographic dispersal of farms and small farm sizes contribute to increasing costs related to biogas production. The Governor's Office in S�r Tr�ndelag has developed digital mapping and analysis methods using GIS to gain insight into the potential of biogas production from the agricultural sector.
The climate is changing. Increased use of renewable energy and reduction of methane (CH4) are some of the ways the agricultural sector can contribute to reduce the effects of global warming. Production of biogas includes both. BioKom, a project of the Governor's Office in S�r Tr�ndelag, has increased the investments in bioenergy in the county since 2007. The focus has been on bioenergy from wood, and digital tools have been developed using ArcGIS to estimate the resource potential in some municipalities. ArcGIS software was selected following intensive comparative analysis by the Governor's Office. In summer 2008, BioKom developed a method to get an overview of and analyze the resources from agriculture that are available for biogas production. Digital mapping and analysis were implemented in the municipalities of Meldal and Orkdal. The agricultural sector produces 9 percent of the total climate gas emissions in Norway and is the biggest source of emissions of methane and nitrous oxide (N2O) in the country. These climate gases are 21 and 310 times stronger, respectively, than carbon dioxide (CO2). Earlier, little had been done to reduce climate gas emissions from the agricultural sector in Norway, which implies that the potential for reduction is large. Biogas, which consists mainly of methane, is formed naturally when animal manure is stored. When biogas is produced under controlled conditions in a reactor, the methane is gathered and stopped from leaking out into the atmosphere. The main content of natural gas is also methane, so the usage of biogas is approximately the same as for natural gas. For example, biogas could be used as fuel for heating or the production of electricity. Biogas is a renewable energy and could substitute for or replace fossil energy sources. In addition, the leftover product from biogas production is an excellent fertilizer and could replace chemical fertilizers. Biogas production in the agricultural sector also gives farmers an opportunity for extra income. BioKom is using ArcGIS to estimate and localize biogas within the agricultural sector in Meldal and Orkdal. Each farm was plotted onto the map with attributes indicating amount and type of manure and its biogas potential. The Density application of ArcGIS Spatial Analyst was used to find areas with relatively high concentrations of biogas and that could be good locations for centralized biogas reactors. The transport distance between the farms and the potential reactor was estimated using the Closest Facility application in ArcGIS Network Analyst. Based on this information, transport costs could be estimated. Animal manure consists of large amounts of water, which makes transport costs a critical factor when building a centralized biogas reactor. The biogas potential of the manure available from farms within a profitable transport distance from the reactor appeared to be 4 and 6 GWh for the two best-suited locations. About the AuthorRagnhild Vognild is the mapping project leader and is with the Governor's Office of S�r Tr�ndelag, Norway. More InformationFor more information, contact Arne Fredik L�nkethe, former project leader, BioKom (e-mail: afl@fmst.no). |