Spring 2009
Spring 2009 |
|||||||
|
|
|||||||
Park Equity Mapping Supports Advocacy for Parks and Healthier Communities |
|||||
|
By Heng Lam Foong, Breece Robertson, and Milton Ospina, Trust for Public Land Highlights
Living a long way from safe and well-designed parks, trails, and public open spaces is now considered a contributing factor in the alarming rates of chronic disease related to physical inactivity in the United States. Studies show that low-income communities of color are disproportionately affected by higher rates of health problems and often have poor access to physical activity settings such as parks, playgrounds, trails, community gardens, and other open spaces. The Trust for Public Land (TPL) Center for Parks and Health (the Center) is using GIS technology to help community stakeholders demonstrate the link between access to parks and open space as well as control chronic diseases and identify areas most in need of better access.
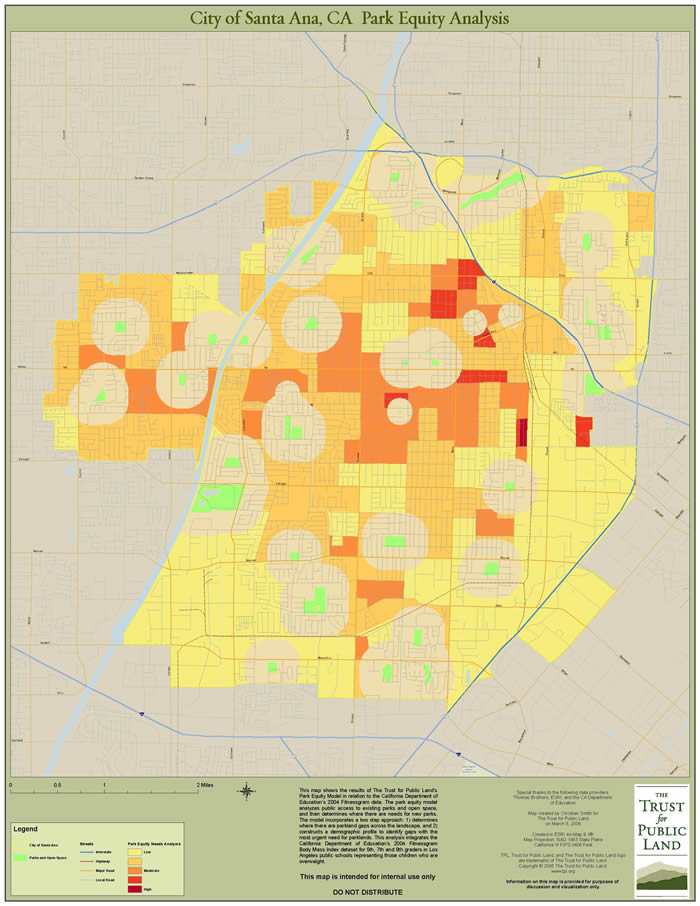
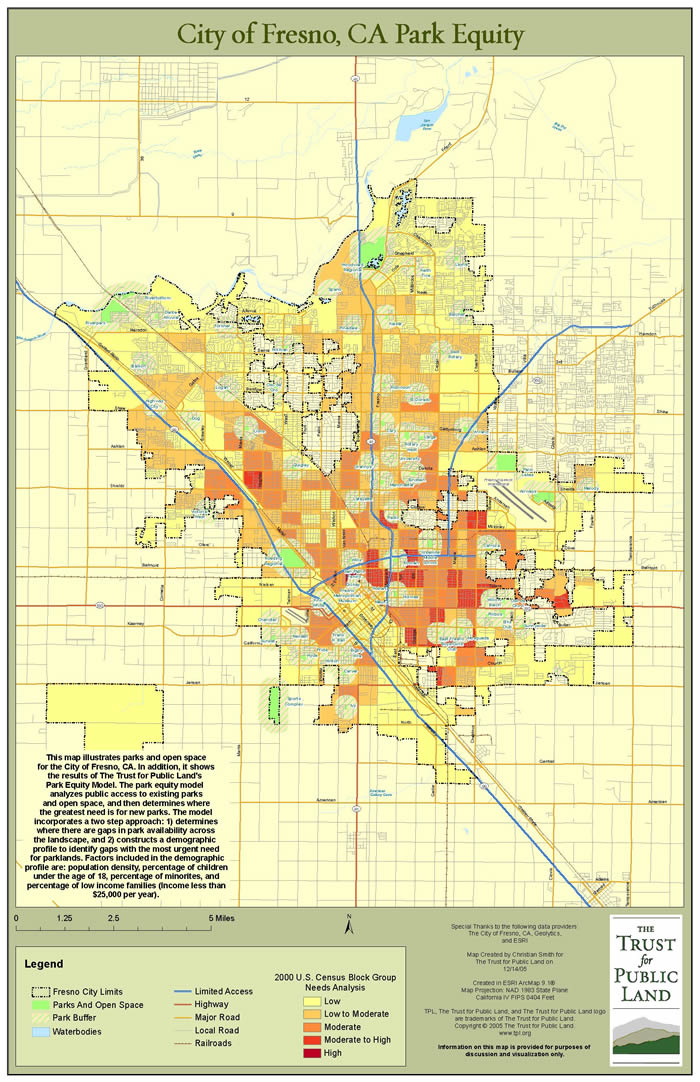
The Center promotes increased public funding for parks, playgrounds, and other physical activity settings as an effective strategy for addressing health disparities and park inequities. It works with communities across the country to utilize GIS modeling methods and health and demographic data to create park equity maps that help demonstrate the connection between good health and access to parks and open space. These park equity maps, which are developed in close collaboration with community health advocacy groups, provide visualization of park and open space access (or lack of access). Local groups can use the maps as outreach, educational, and policy change tools. Elected officials, city staff, planners, public health officials, community-based health organizations, and grassroots community groups can use the maps to help secure support and funding for the new, expanded, or improved parks. GIS park equity mapping employs a two-step approach. First, it uses ArcGIS technology (with which the TPL has had long experience) to determine where gaps in park availability exist across a landscape; then it constructs a demographic profile to identify which gaps are in most urgent need of park lands. These gaps are identified by assigning service and accessibility. Using GIS, areas can be customized for each park based on park type, size, amenities, and carrying capacity. Moreover, up-to-date demographic profiles are included in the GIS and help determine equity in park access according to, for example, children under 18 years of age, population density, and percentage of low-income families. An overlay of park gaps with park needs produces a park equity priority map. High conservation value is assigned to areas having both insufficient park coverage and highest demographic need. The Center also includes socioeconomic variables and data, such as the number of overweight kids in area schools, to identify park gaps in a park system. The correlation between these variables helps pinpoint areas where no parks and high rates of health disparities exist. Central California Park Equity MapsIn June 2007, the Center helped develop park equity priority maps for the Central California Regional Obesity Prevention Program (CCROPP). CCROPP is dedicated to improving the food and physical activity environments of central California communities and to create momentum for widespread changes in the policies and practices that contribute to the rising rates of obesity in the region.
The mapping analysis identified and visualized public access gaps in existing parks and open spaces in a five-county area in Central California. GIS analysis then identified, on the basis of demographic data, which of the gaps indicated the most urgent need for the creation of parks. The result was a series of park equity maps showing the priority of need for parks in Fresno, Kern, Kings, Madera, Merced, and Tulare counties. Santa Ana Park Equity MapsThe city of Santa Ana in Orange County, California, is the eighth most densely populated city in the United States, with 12,471 people per square mile. It also has the highest incidence of overweight children in California, at 34 percent. Furthermore, 24 percent of residents under the age of 18 live below the poverty line, and only 12 percent of the population is non-Hispanic white. To examine park equity in low-income, dense, and primarily Latino neighborhoods of Santa Ana, the Center partnered with Latino Health Access (LHA), a community-based organization. The completed park equity maps identified several neighborhoods in Santa Ana that had poorer access to parks than other similar neighborhoods in California. The park equity maps are now being used to provide evidence to city officials and the school district that built-environment changes are necessary for better health. Because of the urban built-out conditions in Santa Ana, there are few, if any, opportunities to build new parks or playgrounds in the city. Therefore, community health organizations are advocating that the school playgrounds be open to the public after school hours. Today, the Center continues to work with LHA while it helps promote a public ballot measure to improve community access to safe neighborhood physical activity venues and support joint-use access to school playgrounds. Results and BenefitsFor the past three years, the Center has used ArcGIS to support park analyses. It created park equity GIS analyses for central California; Santa Ana, San Mateo, and Los Angeles, California; Pueblo, Colorado; and Yuma, Arizona. At the same time, the Center built a robust database with detailed information on many park systems in the United States. Several of the park analyses include GIS data layers as well as specific details of each park system. The resulting park equity maps are useful as a resource for pursuing new legislation to create or expand park systems. Additionally, many of the maps are used to promote ballot measures to increase public funding for new parks, trails, and open space. More InformationTo learn more about the Trust for Public Land Center for Parks and Health and park equity mapping and to download The Health Benefits of Parks white paper, visit www.tpl.org/hphc. To learn more about park equity mapping methodology, contact Breece Robertson (e-mail: breece.robertson@tpl.org). |