Mile-High Mapping
Denver Addresses Population Growth Within a New Zoning Code
Highlights
- The City and County of Denver recently adopted a new citywide zoning code and map using ArcGIS.
- Drafting the new code was a multiyear effort requiring extensive mapping and spatial analysis.
- GIS provided the opportunity for ongoing public involvement and feedback.
Zoning is a powerful regulatory tool that allows municipalities to guide development and change within their boundaries. It can be used to channel density into the most appropriate locations, protect and maintain established neighborhoods, and promote the desired distribution of land uses well into the future. Recently, the City and County of Denver, Colorado, governing a current population of approximately 600,000 people (expected to increase by another 100,000 in the next 10 years), created and mapped a new zoning code to address modern-day development patterns and increasing population growth.
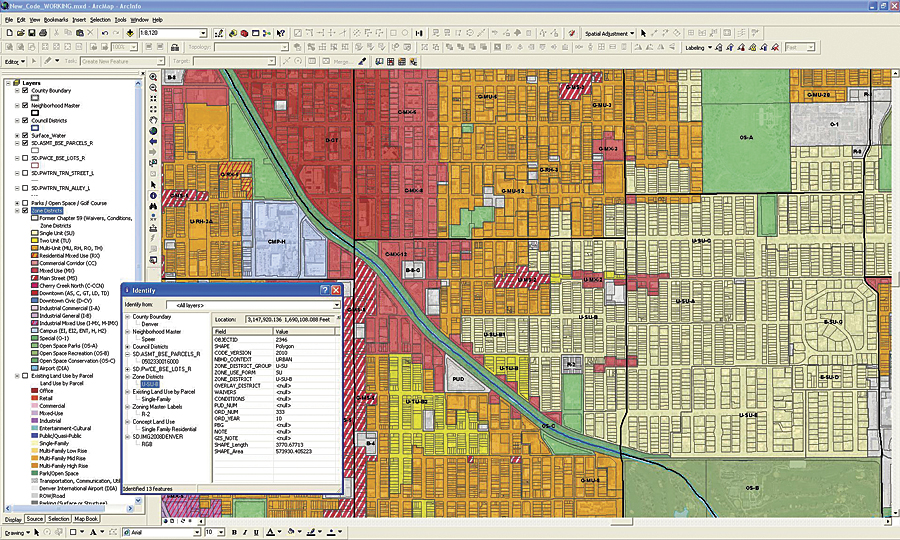
Mapping with ArcGIS using the new zoning code.
Denver's original zoning code was written in 1956 and had become outdated and difficult to follow. Citizens repeatedly called for fixing the code, and in 2009, Mayor John Hickenlooper tasked the Community Planning and Development (CPD) Department to map the new code. CPD, already equipped with two GIS analysts and the full suite of ArcGIS software, was ready to take on the challenge. The new code would be form and context based, where building form, in conjunction with land-use and neighborhood characteristics, would be a driving factor behind regulation. It would be designed by city planners and a mayor-appointed zoning code task force with guidance from the general public.
GIS was an essential tool in mapping the new zoning code throughout Denver, from predrafting stages to the final product. The city has an established central GIS operation, known as Denver GIS, which provides a framework of critical spatial data and all necessary software, including an internal mapping application called Locate, View, Map accessible to city employees. In addition, CPD had transitioned all its original hard-copy zoning maps to digital format in 2006, without which drafting a new code would have been much more challenging. Utilizing these available resources, CPD's GIS team was able to assist planners in identifying ground conditions and important characteristics throughout the city, perform extensive data processing and spatial analysis, and produce hard-copy maps and posters for public meetings. The draft layer was designed and maintained as a geodatabase feature class, while Denver GIS served daily updates via Locate, View, Map.
An external website was also designed for the general public, providing an interactive draft map, as well as downloadable reference maps in PDF format. Through the use of GIS technology and web applications, the city was able to map the new zoning layer digitally and serve the map internally for review then out to the general public, providing transparency and extensive opportunity for feedback.
Preparation for mapping the new zoning code began long before the draft map itself. Although some of the critical base layers already existed in digital format, a number of new layers had to be created or derived from other datasets. Taking a new form- and context-based approach, one of the very first steps was to map neighborhood context throughout the city, which is based on street patterns, the presence or absence of alleys, building forms, parcel dimensions, and the distribution and intensity of land uses. The map teams used existing GIS data, including high-resolution aerial imagery, to help delineate these contexts. Once the new context layer was drafted, ArcGIS was utilized to evaluate and analyze it. For example, the Frequency Statistics tool allowed planners to evaluate the distribution of parcel sizes and determine the appropriate minimum lot sizes within each context.
A second new layer had to do with the preservation of formerly customized zoning. These included old zones with waivers and conditions, Planned Unit Developments, or Planned Building Groups (PBGs). Mapping the PBGs required the extensive process of searching through thousands of site plans and digitizing their boundaries, followed by a quality control check. Combined, these "not to be rezoned" areas were incorporated into the new zoning code layer with their current attributes.
Once the necessary data was compiled, both digital and hard-copy reference maps had to be created. Maps were formatted for Denver's 11 city council districts, as well as for the 78 statistical neighborhoods. Reference maps included current zoning, conceptual and existing land use, aerial imagery, street classifications, parcel sizes, and residential character (showing housing structure types). The planning teams used these for their own reference and at workshops with the general public.
Preparation for mapping the new layer also involved designing a personal geodatabase in ArcGIS. Domains were created for neighborhood context and all zone districts (both for the new menu of zones and to accommodate anything carried over from the old code). Topology was built and maintained along the way.
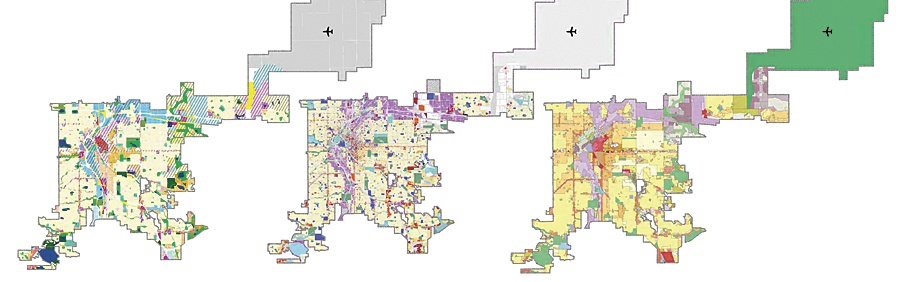
The three main base data layers used in analysis, from left to right: Blueprint Denver Concept Land Use, Existing Land Use, and Zoning (the old code).
After preparation was complete, the actual mapping of the new zoning code occurred in waves based on varying levels of complexity, from areas where existing conditions aligned in concept, use, and regulation to areas with conflicting conditions that required additional analysis. For example, a close look had to be taken at sites zoned for multifamily or high density but identified as primarily single-family neighborhoods or where regulated industrial areas were transitioning to mixed-use residential developments. The CPD GIS team provided information and maps to the planners, who would then return them marked with proposed boundaries to be digitized in ArcGIS. Over time, these boundaries were pieced together to form one complete citywide new zoning layer.
Public involvement is an integral part of the services provided by the Community Planning and Development Department. In the case of the new zoning code, it was especially important to reach out to everyone regardless of technical ability. To start, a series of public meetings was held to present the first round of draft zoning maps and allow public participation and feedback. Residents of each statistical neighborhood were provided with a map of the proposed zoning, as well as the reference maps from which the boundaries were derived. People were invited to mark up the drafts with suggested changes and comments. Through the new zoning code website, people could locate their areas of concern and note comments.
Throughout the drafting process, edits and revisions were continually being made. Planners took into account comments from the public, city council, the business community, and other city departments. The GIS team continued to run various spatial analyses on the new layer and for focus areas throughout the city, such as transportation corridors. Daily updates were pushed out to Locate, View, Map so that planners could review changes. Topology and geometry checks were applied as edits were made, and the domains were adjusted as the menu of zone districts changed to reflect input and feedback.
Upon completion, the new zoning layer contained 120 new zone districts, 43 old zone districts, and 3,553 unique polygons. Denver's new zoning code was unanimously adopted by the city council on June 21, 2010. Final quarter-section zoning maps are generated and maintained using ArcGIS software's Data Driven Pages and posted on the city's website at www.denvergov.org.
For more information, contact Andrea Santoro or Eric McClelland, City and County of Denver (e-mail: andrea.santoro@denvergov.org or eric.mcclelland@denvergov.org).