A Garden's-Eye View
Botanic Garden Adds New Tools—GIS and Remote Imagery
By Ericka Witcher, Collections Supervisor, Montgomery Botanical Center
Highlights
- MBC staff completely converted its old mapping system to a GIS.
- Large-scale analysis with lidar was adapted with GIS to the small-scale garden.
- Because of the flat Florida landscape, MBC staff made its own contour map using ArcGIS.
![]() Montgomery Botanical Center (MBC) in Coral Gables, Florida, serves as a repository of information in the form of population-based, documented, living plant collections. With 120 acres in a subtropical latitude, the nonprofit research institution is able to specialize in palm and cycad taxa that would have difficulty growing elsewhere in the United States. People of all backgrounds—from students to hobbyists to commercial growers—can observe and examine unusual, rare, or endangered specimens they might not have the opportunity to see in the habitats of origin or in side-by-side comparative collections that would not occur in the wild. Due to the exotic origins or sensitive nature of many plants in the collections, however, the center must work to create and maintain an environment that provides their individual needs for life and growth. To that end, staff members are continually looking for new ways to assess the garden property and analyze both its biologic and geologic resources.
Montgomery Botanical Center (MBC) in Coral Gables, Florida, serves as a repository of information in the form of population-based, documented, living plant collections. With 120 acres in a subtropical latitude, the nonprofit research institution is able to specialize in palm and cycad taxa that would have difficulty growing elsewhere in the United States. People of all backgrounds—from students to hobbyists to commercial growers—can observe and examine unusual, rare, or endangered specimens they might not have the opportunity to see in the habitats of origin or in side-by-side comparative collections that would not occur in the wild. Due to the exotic origins or sensitive nature of many plants in the collections, however, the center must work to create and maintain an environment that provides their individual needs for life and growth. To that end, staff members are continually looking for new ways to assess the garden property and analyze both its biologic and geologic resources.
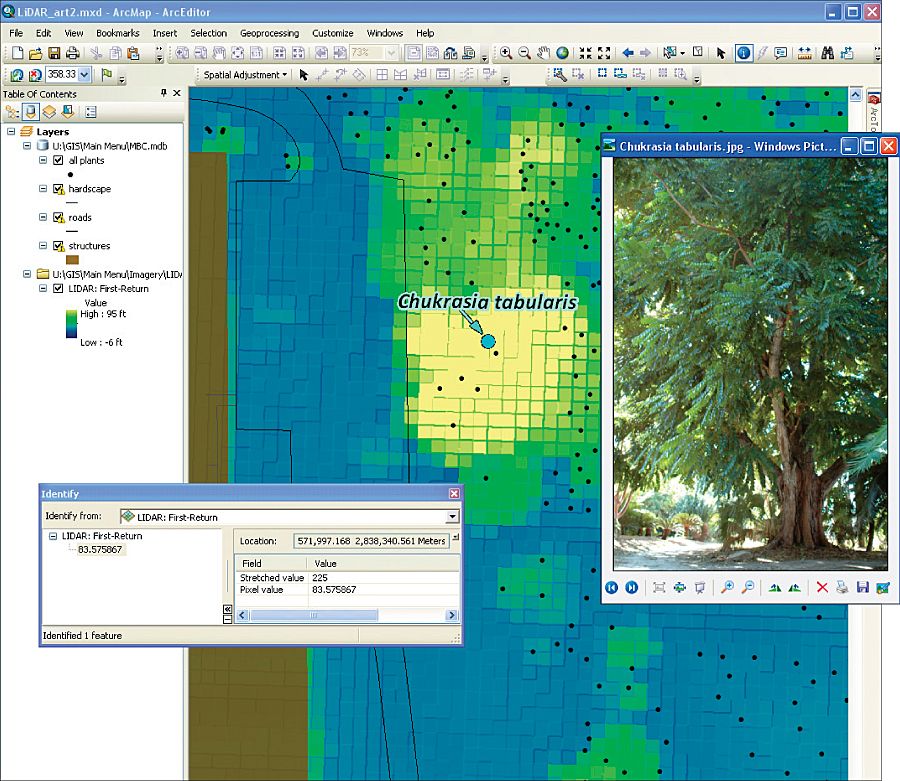
Chukrasia tabularis (Burmese almondwood) is prized for its beautiful hardwood. This specimen at Montgomery Botanical Center (MBC) is the Florida state champion tree and was first identified as a candidate through examination of lidar imagery (scale is in feet).
Like other botanic gardens, for several years, MBC staff had used aerial photographs to examine the tree canopy and other features that were difficult to thoroughly evaluate from ground level. Orthophotographs (planimetrically corrected aerial photographs) and uncorrected aerial photos are frequently used in many different industries, including botanic gardens, for many disparate purposes and are readily available through a variety of sources (e.g., the US Geological Survey [USGS] website or state or county websites). These photos by themselves provided a good general sense of how areas were developing, but the staff experienced a fair amount of difficulty integrating them with its AutoCAD-based maps, so their utility was somewhat limited. Staff wanted a way to view the photos and the maps at the same time, as well as use other types of imagery, then be able to perform spatial analysis.
An ArcGIS for Desktop Standard software grant from Esri for botanical gardens and zoological parks provided an all-in-one solution. Two MBC staff members had prior ArcGIS experience, and with the help of an additional intern, by late 2009 they had completely converted their old mapping system to a GIS and their CAD files to georeferenced feature classes. MBC was then able to add one more tool to its garden shed: remote-sensing data and imagery.
The ability to use remote-sensing data in conjunction with map files opened up entirely new ways of visualizing the garden property. Tree canopies were accurately identified by species by overlaying the mapped plant points onto the orthophotos. Map files of road edges and lake boundaries from 10 years before were adjusted to align with their current locations. Instead of looking at information imposed on a representation of the property, the information was examined in view of the property as a whole in the real world.
MBC also lacked an accurate elevation map. The landscape in South Florida is flat enough that a gain of even one-third of a meter is a substantial difference in regard to the water table and underlying soil, which are of great importance to plants, but such a subtle variation is often difficult to detect while performing fieldwork. To remedy this, in 2010, MBC staff made its own contour map with the ArcGIS Spatial Analyst extension, using a bare-earth light detection and ranging (lidar) image of the property. Lidar imaging uses the measurement of time it takes a laser pulse to be transmitted from and reflected back to an overhead receiver (like an airplane or satellite) to generate a visual dataset. In other words, while aerial photos create a two-dimensional horizontal image, lidar adds a third dimension: elevation. Lidar also is increasingly freely available via download from local, state, and federal government agency websites. A bare-earth lidar image displays ground-level data as opposed to treetops and rooflines. With this height information added to the maps, staff could see geologic aspects that it could only intuit before. Important low-lying inland areas, as well as property high points, were clearly identifiable, and the labeled contour map provided practical delineations for fieldwork.
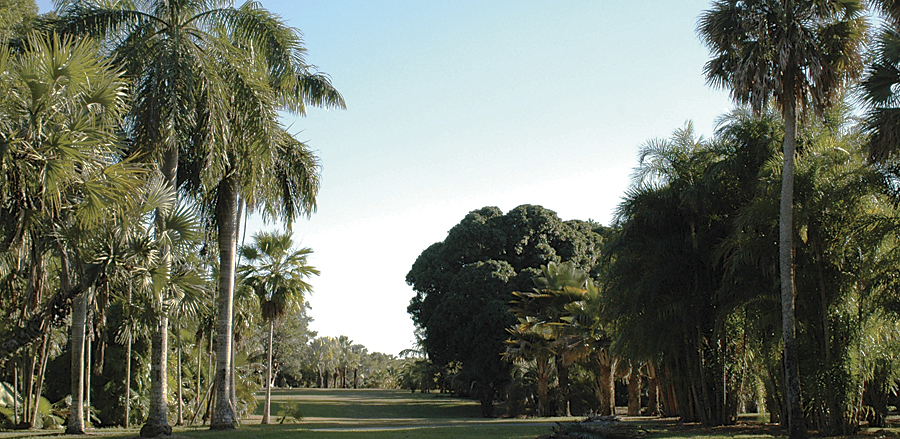
Vegetative and geologic characteristics, like canopy and elevation changes seen here along the Palm Walk, are quantifiable with lidar-integrated maps.
A first-return lidar image also offered a lot of utility for other vegetation-assessment projects. First-return images illuminate all the topmost surfaces of the study area—in this case, canopy height and coverage. In one project, an undeveloped section of the property filled with both an invasive exotic plant, Schinus terebinthifolius (Brazilian peppertree), and protected mangrove trees needed a thorough evaluation to determine the most efficient course of action for managing the land. Canopy height and density were examined in the lidar images, and transects were distributed and performed accordingly. The invasive plant was not found to be as pervasive as feared, and as a result, eradication efforts were scaled down proportionally.
For another project, staff adapted a conventional forestry analysis using first-return lidar images to appraise height and breadth information to establish potential candidates for national or state champion tree status. This was done by simply overlaying the plant point feature class over the first-return image and visually identifying the highest canopies. The plant curators also applied their in-field knowledge of the various species' usual growth habits to propose more individuals for assessment, the height and spread of which were also checked in the lidar map. As of this writing, 27 trees had been awarded state champion status by the Florida Division of Forestry, and 2 trees received national champion status from American Forests.
Overall, says MBC executive director Patrick Griffith, "GIS has made many basic botanic garden tasks here much more efficient and planning much more effective. It has helped our many audiences better visualize what we seek to communicate."
By employing imagery in ArcGIS for Desktop and adapting some of the more basic and conventional uses of lidar for regional landscapes to the localized, relatively small-scale botanical garden, MBC staff saved many hours of laborious fieldwork and gained a nuanced understanding of the property and plants under its care.
About the Author
Ericka Witcher is the collections supervisor for Montgomery Botanical Center in Coral Gables, Florida. Her work there involves using GIS for research and maintenance of the plant collections.
For more information, contact Ericka Witcher, collections supervisor, Montgomery Botanical Center (e-mail: erickaw@montgomerybotanical.org).