Optimizing New York City's School Bus Contract Bidding Process
By Kevin Jenkins, Tim Calabrese, and Joanna Laroussi, New York City Department of Education, Office of Pupil Transportation, and Holly Orr, New York University, Global Technology Services
Highlights
- ArcGIS provides potential bidders with spatial views of the past three years of busing data.
- GIS helps avert the Department of Education's worst-case scenario—overbidding.
- The application is based on an ArcGIS API for Silverlight template.
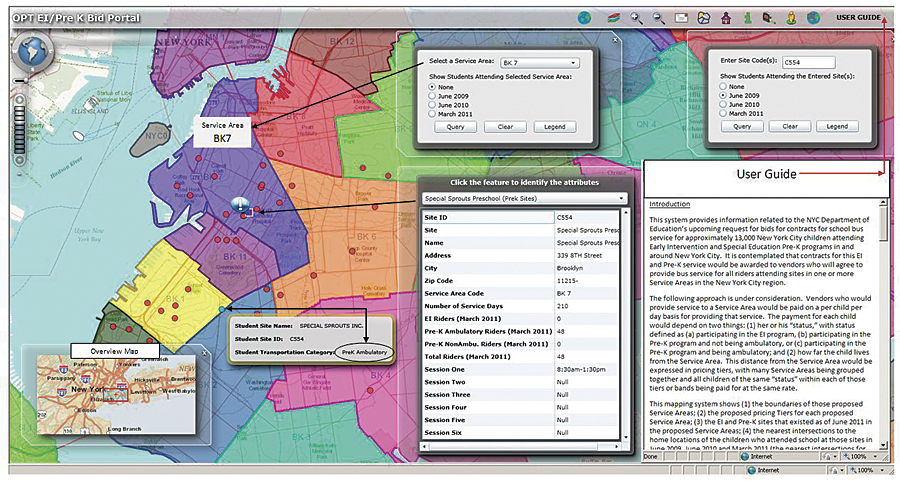
The New York City (NYC) Department of Education's (DOE) Office of Pupil Transportation (OPT) manages the transportation needs of NYC schoolchildren, including special education pre-K programs. Though busing is overseen by OPT, the buses are owned and operated by private companies. To facilitate a new transportation contract bidding process, OPT created a web-based mapping system that allows potential bidders to see pre-K schools, service area boundaries, pricing tiers, and historical attendance data.
In the past, bus companies bid on each school as a unique entity. The main goal of the new system, according to Eric Goldstein, chief executive of the NYC Department of Education's Office of School Support Services, is "to allow bus companies and OPT to use economies of scale in providing service to schools that are in close proximity."
2009 pre-K special education students for an individual school are shown by pricing tier. With historical perspective, bus companies can estimate appropriate per-child bids for each pricing tier based on distance and number of students per pricing tier, as well as the special needs of individual students.
After instituting a new service area-based system for awarding contracts, OPT received feedback from its vendors that a general count estimate of students attending each facility was not sufficient to ensure a safe profit margin while also allowing them to submit a competitive bid. Under the new system, instituted in 2011, the city had been divided into 43 service areas, reflecting neighborhood and transportation corridor geographies. Pre-K busing to all schools within a service area would be awarded to the same vendor. However, since pre-K students often attend school in a service area other than the one in which they live, the city was also divided into different pricing tiers (PT) to reflect the varying distances to each target service area. Pricing tiers are composed of one or more service areas that share common routing challenges. The new system requires a vendor to submit a different bid for each PT to its target service area. The system is similar to that used by taxis in some urban areas, where the fare is not based on true distance or time but rather on fixed costs between zones.
Other variables complicate the routing process. Special education students have physical, mental, or developmental disabilities that dictate the appropriate transportation service required. Costs associated with transporting each disability type can vary widely. Bus companies are asked to provide an estimate for each of three classes of pupils—ambulatory, nonambulatory (children in wheelchairs), and Early Intervention (a special program for pre-pre-K students under the age of three)—from each PT to the target service area. One pupil in a far-flung PT who requires a wheelchair ramp or lift can dramatically increase the cost to the vendor of serving that area. If this information is not known at the time of the bid, it could make an entire route unprofitable for the vendor. Thus, the new system, which was designed to reduce costs by consolidating busing to each service area, could end up having the opposite effect if vendors began bidding on contracts based on potential but unknown worst-case scenarios.
Simply stated, if lower per-pupil bids were to be achieved, DOE needed to provide a better means for vendors to estimate their true costs. The solution DOE proposed was to provide three years of student historical data by location for each disability class. Potential bidders can see the number and location of pre-K students, categorized by disability class, for the past three years.
DOE provided this data as a web-based mapping application, where bidders could easily visualize service areas, pricing tiers, and pupil distribution patterns that would help them make informed bids. The service area and pricing tier files were created using ArcGIS 10 for Desktop. Student addresses were geocoded and then spatially adjusted to nearby intersections to protect confidentiality. Pre-K schools were also geocoded. The datasets were uploaded to ArcGIS for Server and a web-based application built to display the data and provide users with query capability. The application was based on the ArcGIS API for Silverlight Glass template, accessed from ArcGIS Resource Center. The coding process was intuitive, and OPT was able to build the application in about 15 days. The Esri template provided a quick palette to begin assembly, while the Esri development components for navigation, toolbars, and overview maps made it easy to add basic elements. In addition, the availability of source code for the toolkits enabled OPT to customize the tools to suit the skills of the end users.
The resultant website hosts a mapping system that shows
- Boundaries of the service areas
- Pricing tiers for each service area
- Schools
- Children who attended those sites for the prior three years
- Disability status of children
A critical function of the application is that the data can be queried by service area or school. This allows bus vendors to more accurately base bids on historical patterns as they transition from the old system of individual school routes to the new system of service areas. The application also contains basic GIS functionality, such as Esri and Bing basemaps, an Esri address locator, zoom and measure tools, and an overview map. The application used maps from an Internet mapping service to create embeddable image viewers with a simple click. Finally, because the application end users are not experienced with GIS, the application is equipped with a user guide explaining each tool and function.
"The beauty of this application," concludes Goldstein, "is that it takes very complicated and extensive datasets and creates the most basic type of map—dot density—for the three prior years. With just a few clicks, a busing vendor can create the type of map most understandable to a non-GIS professional."
Without the complete suite of tools supplied by Esri and the ease of transfer between platforms, OPT would not have been able to so easily provide such an on-the-fly tool to assist vendors in submitting a profitable and competitive bid. More importantly for OPT, this tool may have prevented worst-case scenario overbidding and thus helped OPT reach its goal of achieving lower per-child bids.
Success of this application has motivated OPT to begin development of further applications with extended functionality on a map portal that serves as a data viewer for all of OPT's spatial data on schools, students, bus stops, and bus routes. It is hoped that this web portal will provide OPT staff, school administrators, and eventually the public with access to visualization tools that will help them understand the complexities of NYC's school busing systems. For example, OPT will be able to verify bus route logistics, school administrators would be able to determine which children should be offered busing, and parents could determine the best walking route to their child's school. In a system of over 1.1 million schoolchildren within an urban environment as complicated as New York City, such a portal could bring a new level of data integration and transparency to an immensely complicated, and important, city service.
About the Authors
Three authors are with the New York City Department of Education's Office of Pupil Transportation (OPT) GIS Department, where Tim Calabrese is manager, Joanna Laroussi is GIS administrator, and Kevin Jenkins is a GIS analyst. All three graduated from or are currently attending City University of New York's Masters in Geography/GIS program at Hunter College in Manhattan. Holly Orr, formerly of OPT, is a GIS application developer/specialist at New York University, Global Technology Services.
For more information, contact Tim Calabrese, New York City Department of Education, Office of Pupil Transportation (e-mail: tcalabrese@schools.nyc.gov), or visit gis.opt-osfns.org/prekei/default.html.